
STRONG BUY Setup 💻
Entry: ₹6,316-6,340 (Current Level)
Target 1: ₹6,474-6,500
Target 2: ₹6,587-6,620
Target 3: ₹6,700-6,750
Target 4: ₹6,900-7,000+ (Extended Breakout Target)
Stop Loss: ₹6,082
Technical Rationale:
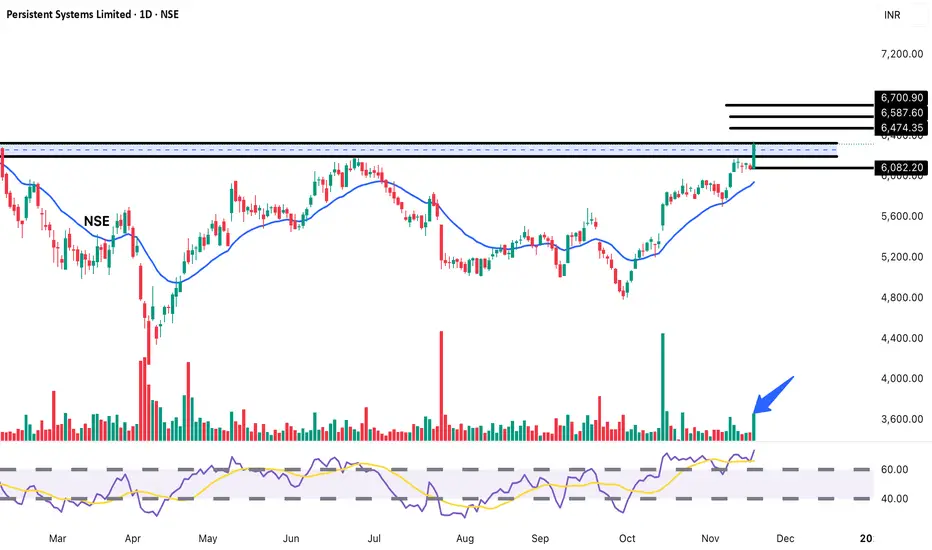
MASSIVE BREAKOUT from year-long resistance at 6,250 (horizontal black line at top)
Explosive +3.89% surge with exceptional volume spike (874.8K - highlighted with blue arrow)
Breaking above major resistance zone decisively on daily chart
Trading above long-term horizontal resistance after multiple tests throughout 2025
Volume is highest in months - institutional buying evident
Strong uptrend intact - trading above rising EMA (blue curve)
RSI around 65-70 - strong bullish momentum with room for upside
IT Services sector showing strength - digital transformation demand
Multiple resistance levels mapped: 6,474, 6,587, 6,700
Clear support established at breakout zone 6,250 and 6,082
Previous all-time high territory being challenged
Pattern shows consistent higher lows since October bottom
Risk-Reward: Excellent 1:2.5 to 1:4+ ratio depending on targets
Pattern: HORIZONTAL RESISTANCE BREAKOUT on DAILY Chart - breaking year-long ceiling with exceptional volume
Strategy: Medium-term swing to positional (weeks to months)
Book 20% at T1 (6,490), 20% at T2 (6,600), 20% at T3 (6,725)
Hold remaining 40% for extended target 6,900-7,000+
Trail SL to 6,320 after crossing T1
Disclaimer: For educational purposes only. Not SEBI registered.
交易進行
Target 1: ₹6,474-6,500 done
免責聲明
這些資訊和出版物並非旨在提供,也不構成TradingView提供或認可的任何形式的財務、投資、交易或其他類型的建議或推薦。請閱讀使用條款以了解更多資訊。