
hey Guys,
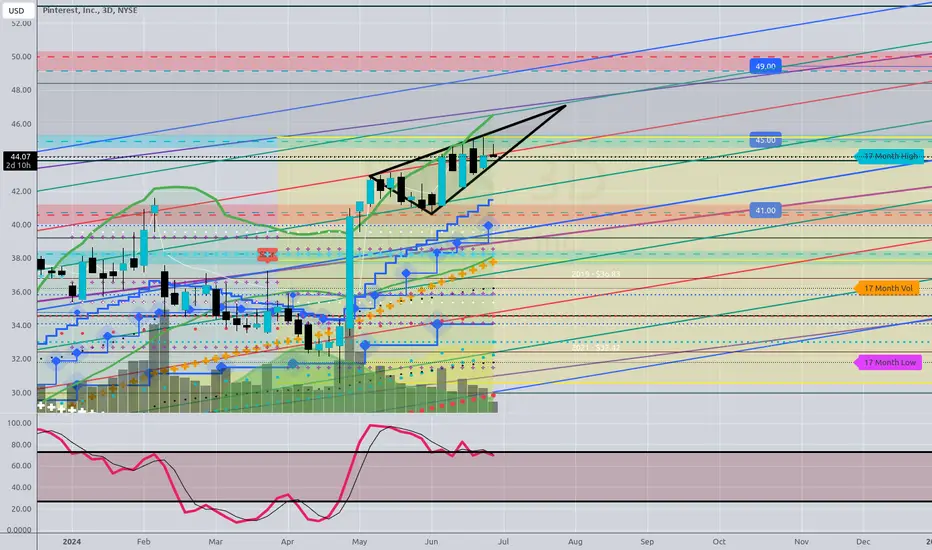
- Yearly Chart is bullish, Double Bottom and Engulfing Candle.
->Targets … 41 … 45 … 49.
Quarterly: Bullish Candle breakout above the Highs of Q1.
-> But it is retesting a major supply line and a yearly FIB. - creating a Grey Zone which divides the Stock into a bearish zone below and bullish zone above.
Monthly: Bullish candle - Stochastic Bullish but OB.
-> caution as we could see some Profit taking / reloading at lower prices.
3D: Signs of a possible reversal: Ascending Triangle, Fifth Wave, Diagonal Moving Stock (Distortion?)
Breakout to the upside would be extremely bullish…
Lower prices could be seen as a great buying opportunity.
targets Bears: 41 38
Targets Bulls: 45 49
Please let me know if you would like me to analyse an Instrument for you.
Thanks for reading
- Yearly Chart is bullish, Double Bottom and Engulfing Candle.
->Targets … 41 … 45 … 49.
Quarterly: Bullish Candle breakout above the Highs of Q1.
-> But it is retesting a major supply line and a yearly FIB. - creating a Grey Zone which divides the Stock into a bearish zone below and bullish zone above.
Monthly: Bullish candle - Stochastic Bullish but OB.
-> caution as we could see some Profit taking / reloading at lower prices.
3D: Signs of a possible reversal: Ascending Triangle, Fifth Wave, Diagonal Moving Stock (Distortion?)
Breakout to the upside would be extremely bullish…
Lower prices could be seen as a great buying opportunity.
targets Bears: 41 38
Targets Bulls: 45 49
Please let me know if you would like me to analyse an Instrument for you.
Thanks for reading

免責聲明
這些資訊和出版物並非旨在提供,也不構成TradingView提供或認可的任何形式的財務、投資、交易或其他類型的建議或推薦。請閱讀使用條款以了解更多資訊。