
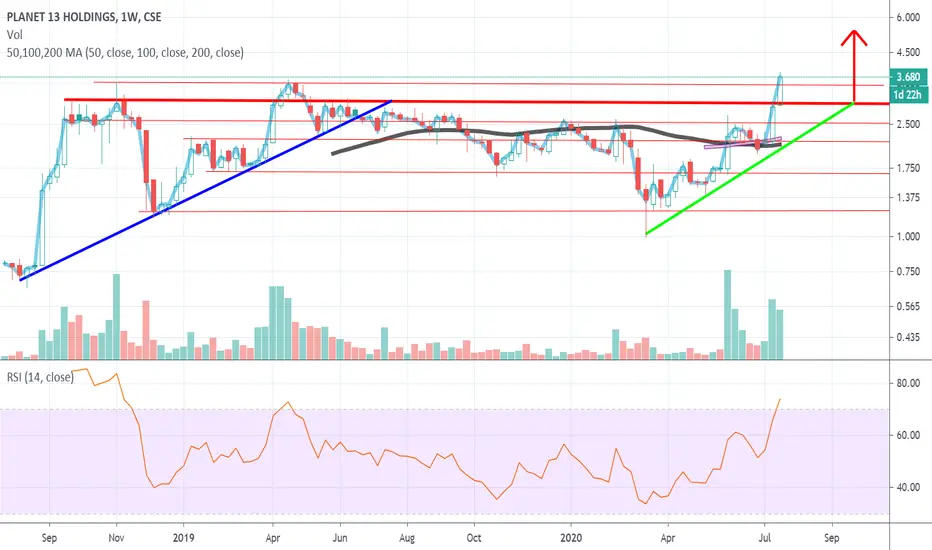
Planet 13 Holdings is displaying a strong breakout of a Ascending Triangle.
Notice the difference in higher high creation on the RSI of this Ascending Triangle compared to the previous one in 2018 & early 2020 that played out bearishly.
I have colored the upward sloping support Blue on the previous ascending triangle, as opposed to Green on the current ascending triangle pattern breakout.
This chart is done on a log scale.

免責聲明
這些資訊和出版物並非旨在提供,也不構成TradingView提供或認可的任何形式的財務、投資、交易或其他類型的建議或推薦。請閱讀使用條款以了解更多資訊。
免責聲明
這些資訊和出版物並非旨在提供,也不構成TradingView提供或認可的任何形式的財務、投資、交易或其他類型的建議或推薦。請閱讀使用條款以了解更多資訊。