PLTR mapping the current situation. What can we expect?
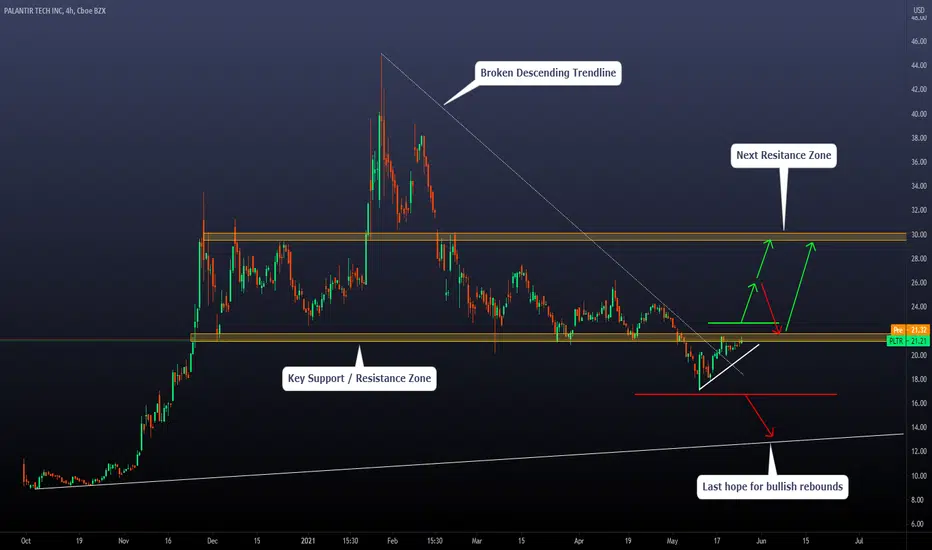
Today, we will take a look at the 4HS chart on PLTR
Current situation: The price is below a Massive support zone now working as a resistance. This is a key level because we can deduce major directions if the price stays above or below the key level.
Bearish Scenario: If the price reaches the red line, we can expect a continuation of the bearish movement towards the next trendline, which is not something clear but, if we have to create a possible level to see some bullish pressure, we think that would be one.
Bullish Scenario: If the price breaks the key support/resistance zone and reaches the green line, we can expect either a direct continuation of the bullish movement towards the next resistance zone OR a throwback (retest of a key level after being broken) and a continuation movement towards the next resistance zone.
Thanks for reading!
Current situation: The price is below a Massive support zone now working as a resistance. This is a key level because we can deduce major directions if the price stays above or below the key level.
Bearish Scenario: If the price reaches the red line, we can expect a continuation of the bearish movement towards the next trendline, which is not something clear but, if we have to create a possible level to see some bullish pressure, we think that would be one.
Bullish Scenario: If the price breaks the key support/resistance zone and reaches the green line, we can expect either a direct continuation of the bullish movement towards the next resistance zone OR a throwback (retest of a key level after being broken) and a continuation movement towards the next resistance zone.
Thanks for reading!

免責聲明
這些資訊和出版物並非旨在提供,也不構成TradingView提供或認可的任何形式的財務、投資、交易或其他類型的建議或推薦。請閱讀使用條款以了解更多資訊。
免責聲明
這些資訊和出版物並非旨在提供,也不構成TradingView提供或認可的任何形式的財務、投資、交易或其他類型的建議或推薦。請閱讀使用條款以了解更多資訊。