
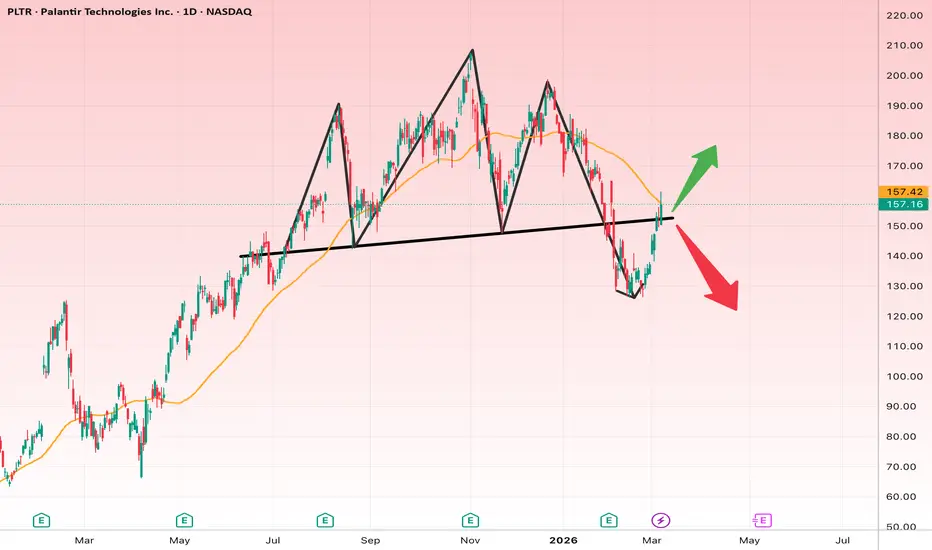
The chart is on the daily timeframe and shows a classic trendline breakdown followed by a pullback.
Key observations:
• The long-term uptrend line has been broken
• Price dropped sharply after the break
• The current move is a pullback to the broken trendline
• The moving average (orange line) is acting as resistance
This is a critical decision zone for the market.
Short-Term Outlook
The key zone is $150–$160.
Bullish Scenario
If price reclaims and holds above $160, a recovery rally is possible.
Targets:
First target
$170
Second target
$182
Third target
$195
Stop loss
$148
Bearish Scenario
If price fails to break resistance and gets rejected:
Targets:
First target
$135
Second target
$125
Third target
$110
Stop loss for short trades
$162
Long-Term Outlook
From a macro perspective, the stock still maintains a bullish structure.
Long-term targets:
First target
$200
Second target
$230
Third target
$260
Long-term stop loss
Below
$120
Fundamental Overview
Palantir Technologies operates in data analytics and artificial intelligence, two rapidly growing sectors.
Key positives:
• Strong AI market growth
• Large government contracts
• Increasing commercial revenue
• Achieved profitability
Main risks:
• High valuation
• Sensitivity to tech sector sentiment
Overall, the long-term outlook remains positive but volatile.
✅ Final Insight
The $150–$160 range is the key decision zone.
Above it → potential rally toward $180–$200
Below it → possible correction toward $125
Key observations:
• The long-term uptrend line has been broken
• Price dropped sharply after the break
• The current move is a pullback to the broken trendline
• The moving average (orange line) is acting as resistance
This is a critical decision zone for the market.
Short-Term Outlook
The key zone is $150–$160.
Bullish Scenario
If price reclaims and holds above $160, a recovery rally is possible.
Targets:
First target
$170
Second target
$182
Third target
$195
Stop loss
$148
Bearish Scenario
If price fails to break resistance and gets rejected:
Targets:
First target
$135
Second target
$125
Third target
$110
Stop loss for short trades
$162
Long-Term Outlook
From a macro perspective, the stock still maintains a bullish structure.
Long-term targets:
First target
$200
Second target
$230
Third target
$260
Long-term stop loss
Below
$120
Fundamental Overview
Palantir Technologies operates in data analytics and artificial intelligence, two rapidly growing sectors.
Key positives:
• Strong AI market growth
• Large government contracts
• Increasing commercial revenue
• Achieved profitability
Main risks:
• High valuation
• Sensitivity to tech sector sentiment
Overall, the long-term outlook remains positive but volatile.
✅ Final Insight
The $150–$160 range is the key decision zone.
Above it → potential rally toward $180–$200
Below it → possible correction toward $125

免責聲明
這些資訊和出版物並非旨在提供,也不構成TradingView提供或認可的任何形式的財務、投資、交易或其他類型的建議或推薦。請閱讀使用條款以了解更多資訊。
免責聲明
這些資訊和出版物並非旨在提供,也不構成TradingView提供或認可的任何形式的財務、投資、交易或其他類型的建議或推薦。請閱讀使用條款以了解更多資訊。