
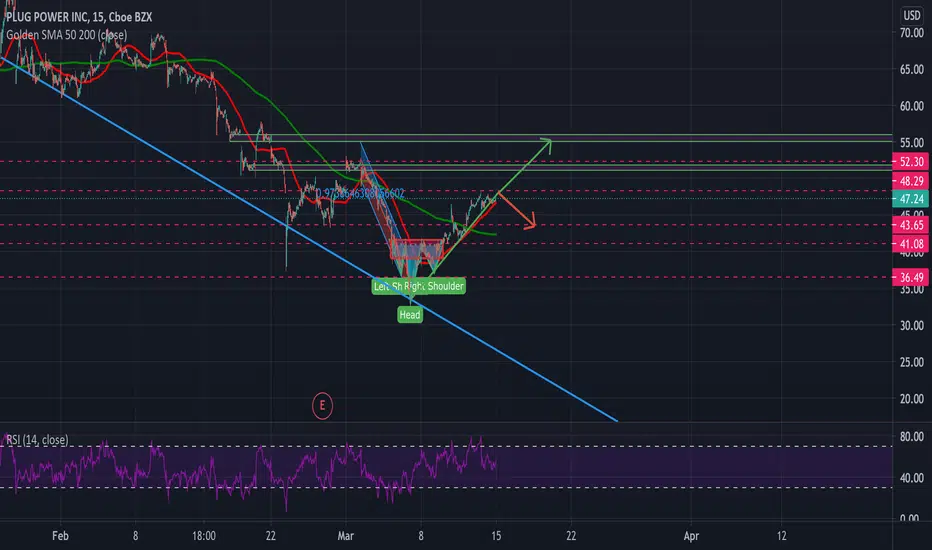
After a long regression, PLUG seems to have found its bottom after falling 40% from its 52-week high ending the regression with an inverse head and shoulders. Bollinger Bands are squeezing on its 6-month chart along with what looks like an impending MACD cross. PLUG needs to break the FIB resistance levels charted which seems relatively likely as long as the broader market doesn't experience a pullback as 10-year treasury yields have been fluctuating. PT1- $51.81, PT2- $56.19
Has strong top resistance at the $69-70 level
Has strong top resistance at the $69-70 level

免責聲明
這些資訊和出版物並非旨在提供,也不構成TradingView提供或認可的任何形式的財務、投資、交易或其他類型的建議或推薦。請閱讀使用條款以了解更多資訊。
免責聲明
這些資訊和出版物並非旨在提供,也不構成TradingView提供或認可的任何形式的財務、投資、交易或其他類型的建議或推薦。請閱讀使用條款以了解更多資訊。