做空
$PS 5 Month #Rectanle #ChartPattern
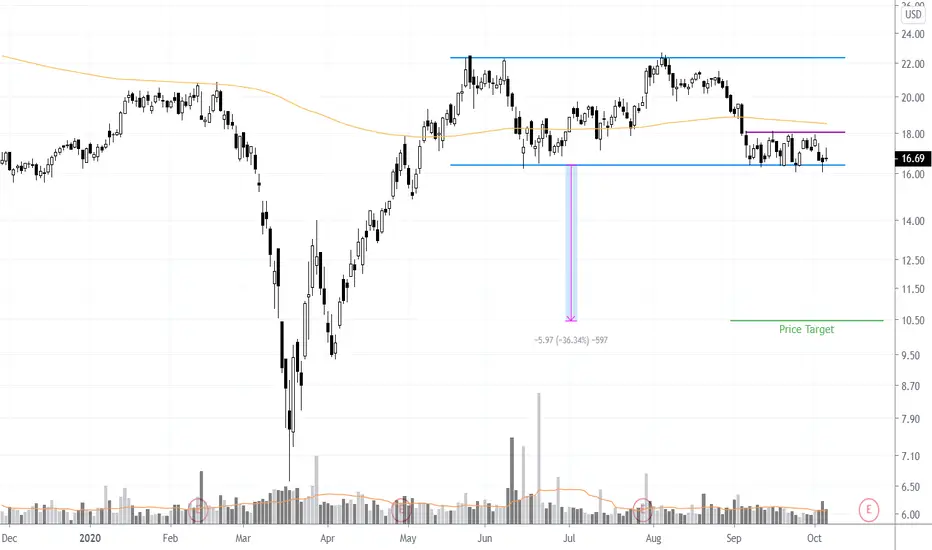
Another short I'm tracking for this week is $NASDAQ:PS.
It formed a 5 month rectangle with $16.40 acting as support. The stock broke the 200 MA and been consolidating right below it forming a month long rectangle failing to stage a meaningful bounce from rectangle lower boundary with $18 acting as strong resistance.
A clear close below $16.40 will complete the 5 month rectangle chart pattern and trigger a short entry.
Chart pattern price target added to chart.
It formed a 5 month rectangle with $16.40 acting as support. The stock broke the 200 MA and been consolidating right below it forming a month long rectangle failing to stage a meaningful bounce from rectangle lower boundary with $18 acting as strong resistance.
A clear close below $16.40 will complete the 5 month rectangle chart pattern and trigger a short entry.
Chart pattern price target added to chart.

✔ Momentum & Breakout Trader Since 2006 | Influenced by Mark Minervini VCP Trading Style & William O'Neil CANSLIM 📈
✔ Follow me on Twitter @taplot - twitter.com/TaPlot
✔ YouTube channel youtube.com/@taplot
✔ Follow me on Twitter @taplot - twitter.com/TaPlot
✔ YouTube channel youtube.com/@taplot
免責聲明
這些資訊和出版物並非旨在提供,也不構成TradingView提供或認可的任何形式的財務、投資、交易或其他類型的建議或推薦。請閱讀使用條款以了解更多資訊。
✔ Momentum & Breakout Trader Since 2006 | Influenced by Mark Minervini VCP Trading Style & William O'Neil CANSLIM 📈
✔ Follow me on Twitter @taplot - twitter.com/TaPlot
✔ YouTube channel youtube.com/@taplot
✔ Follow me on Twitter @taplot - twitter.com/TaPlot
✔ YouTube channel youtube.com/@taplot
免責聲明
這些資訊和出版物並非旨在提供,也不構成TradingView提供或認可的任何形式的財務、投資、交易或其他類型的建議或推薦。請閱讀使用條款以了解更多資訊。