
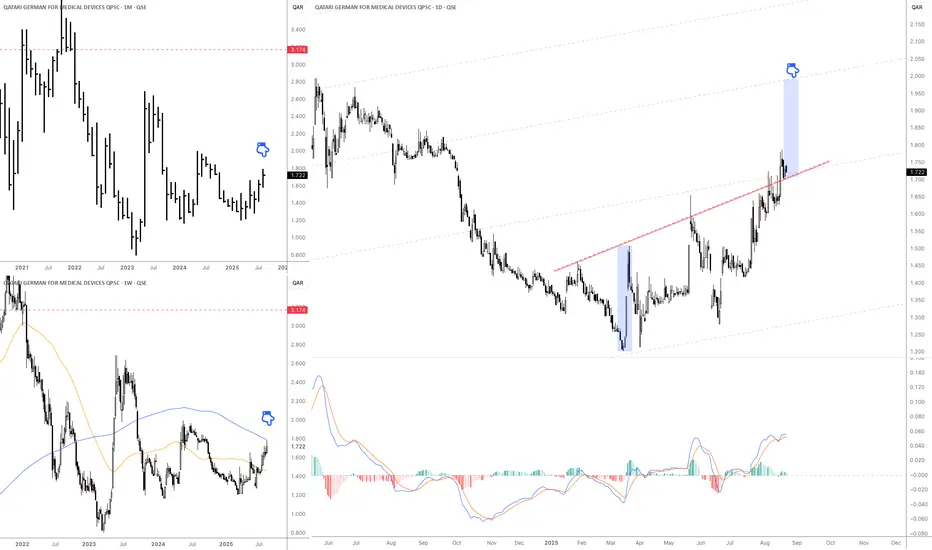
1. Monthly Chart (top-left)
Current price is around QAR 1.72 – 1.80.
Long-term trend has been bearish, but the stock seems to be forming a base and gradually moving higher.
Major long-term resistance sits at QAR 3.17.
2. Weekly Chart (bottom-left)
The 200-week moving average (blue) is close to the current price → a strong resistance test.
A confirmed breakout above the 200-week MA would strengthen the bullish case.
The 50-week moving average (orange) is turning upward, signaling improving momentum.
3. Daily Chart (right side)
The stock broke above a downtrend line (red) and is now holding above it, showing a bullish breakout.
The projected short-term target is around QAR 2.00 – 2.05, based on the rising channel.
MACD indicator is positive, supporting continued bullish momentum.
Key Levels
Nearest Support: QAR 1.60 – 1.65
Short-term Resistance: QAR 2.00 – 2.05
Long-term Resistance: QAR 3.17
Current price is around QAR 1.72 – 1.80.
Long-term trend has been bearish, but the stock seems to be forming a base and gradually moving higher.
Major long-term resistance sits at QAR 3.17.
2. Weekly Chart (bottom-left)
The 200-week moving average (blue) is close to the current price → a strong resistance test.
A confirmed breakout above the 200-week MA would strengthen the bullish case.
The 50-week moving average (orange) is turning upward, signaling improving momentum.
3. Daily Chart (right side)
The stock broke above a downtrend line (red) and is now holding above it, showing a bullish breakout.
The projected short-term target is around QAR 2.00 – 2.05, based on the rising channel.
MACD indicator is positive, supporting continued bullish momentum.
Key Levels
Nearest Support: QAR 1.60 – 1.65
Short-term Resistance: QAR 2.00 – 2.05
Long-term Resistance: QAR 3.17

免責聲明
這些資訊和出版物並非旨在提供,也不構成TradingView提供或認可的任何形式的財務、投資、交易或其他類型的建議或推薦。請閱讀使用條款以了解更多資訊。