
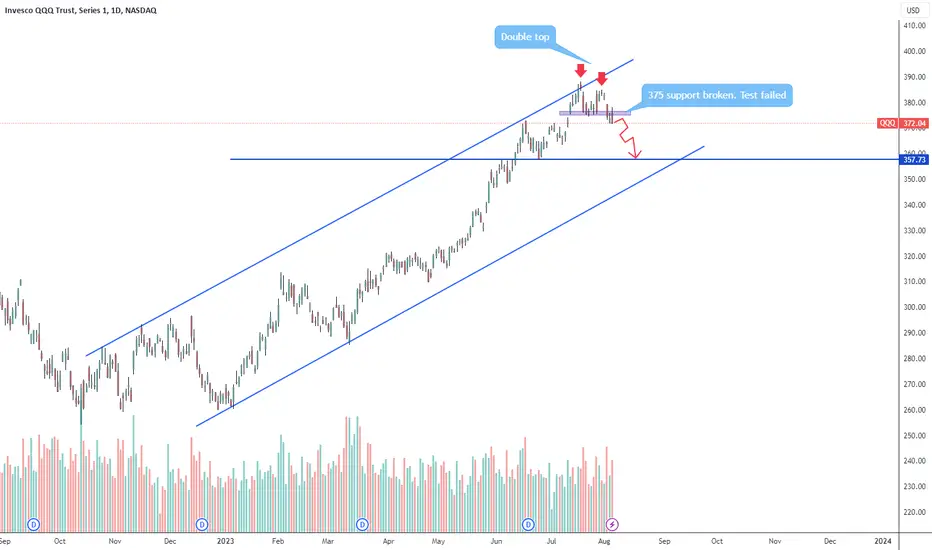
Double top confirmed in the daily timeframe. I think we are going to see a correction towards the 360 zone. I'm not trading this, I haven't had much success trading indexes, I prefer stocks. It's very possible that bulls push the price again to the $375 zone now resistance. That's the thing with indexes, sometimes looks like a free fall but suddenly buyers come out from nothing and push the price up for a day or two and puts expire. Don't tell that never happened to you. I use this to see the sentiment of the market. Yesterday I bought a bunch of puts of AAL, MRNA, AMD, CROCS and TXN, all showing strong bearish patterns. At every pull back up I will buy more.
註釋
Let me revise my previous analysis. I find the chart below more accurate. We will see a final push to the downside this week. There is a lot of support at the 365 level. I think we may also see a false break down (watch out bears) and then a hard rejection off the support. In the mean time I'm closing my shorts and adding to my longs at every dip.註釋
I usually don't use lower timeframes but sometimes I like to look closer. This is a 4H chart. Doji candlestick at the ascending channel support. We will see some turbulence tomorrow:
免責聲明
這些資訊和出版物並非旨在提供,也不構成TradingView提供或認可的任何形式的財務、投資、交易或其他類型的建議或推薦。請閱讀使用條款以了解更多資訊。