
📌 Charting Breakdown
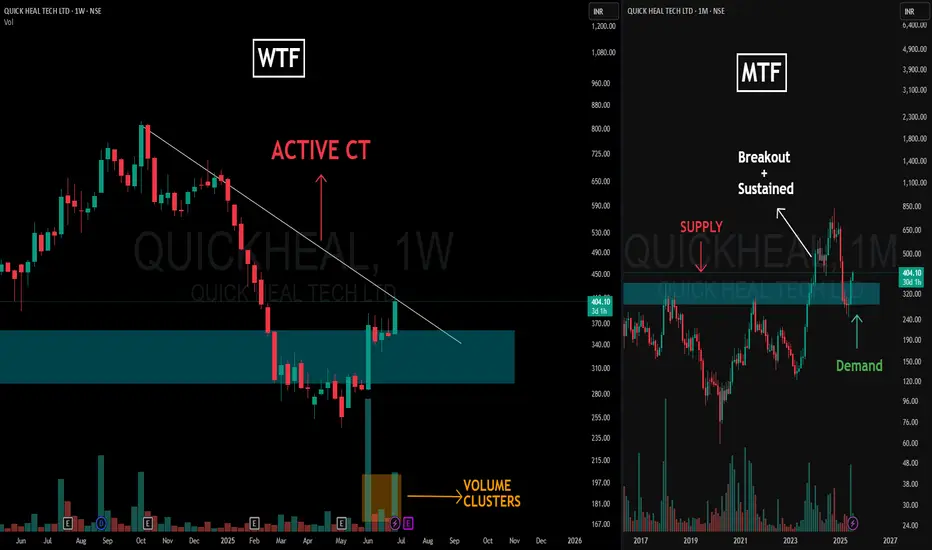
This post dives into a clean Multi-Timeframe Analysis (MTFA) for QUICKHEAL using structural logic — with Weekly Time Frame (WTF) on the left and Monthly Time Frame (MTF) on the right.
🔍 Left Side – Weekly Time Frame (WTF)
-The Active CT (Counter-Trend) is marked via the dominant trendline resistance, which price is actively engaging.
-We observe a strong Volume Cluster forming near the base of the reclaimed demand zone — often a sign of accumulation or significant interest.
🧠 Right Side – Monthly Time Frame (MTF)
-Here, a textbook Supply & Demand Conversion is visualized.
-Initially, price reacted to a clear Supply Zone, creating the resistance base.
-Once that zone was broken with strength and sustained above it, the previous supply area transformed into Demand, validating the impulse move.
-Price then returned to test this now-converted zone — an SR flip seen through the lens of supply-demand logic, not just support/resistance lines.
🧾 Disclaimer:
This post is not a forecast, tip, or financial advice. It is purely an educational breakdown of price structure and market behavior based on my personal charting style. Feel free to ask your doubts or thoughts in the comments — let’s build clarity, not predictions.
This post dives into a clean Multi-Timeframe Analysis (MTFA) for QUICKHEAL using structural logic — with Weekly Time Frame (WTF) on the left and Monthly Time Frame (MTF) on the right.
🔍 Left Side – Weekly Time Frame (WTF)
-The Active CT (Counter-Trend) is marked via the dominant trendline resistance, which price is actively engaging.
-We observe a strong Volume Cluster forming near the base of the reclaimed demand zone — often a sign of accumulation or significant interest.
🧠 Right Side – Monthly Time Frame (MTF)
-Here, a textbook Supply & Demand Conversion is visualized.
-Initially, price reacted to a clear Supply Zone, creating the resistance base.
-Once that zone was broken with strength and sustained above it, the previous supply area transformed into Demand, validating the impulse move.
-Price then returned to test this now-converted zone — an SR flip seen through the lens of supply-demand logic, not just support/resistance lines.
🧾 Disclaimer:
This post is not a forecast, tip, or financial advice. It is purely an educational breakdown of price structure and market behavior based on my personal charting style. Feel free to ask your doubts or thoughts in the comments — let’s build clarity, not predictions.

🏆 WHATSAPP ME : wa.me/919455664601
🏆 MY TELEGRAM : t.me/hashtaghammer
🏆 MY BOOK ( TRADING IS AN EMOTION ) : tinyurl.com/TradingISanEMOTION
🏆 MY TELEGRAM : t.me/hashtaghammer
🏆 MY BOOK ( TRADING IS AN EMOTION ) : tinyurl.com/TradingISanEMOTION
相關出版品
免責聲明
這些資訊和出版物並非旨在提供,也不構成TradingView提供或認可的任何形式的財務、投資、交易或其他類型的建議或推薦。請閱讀使用條款以了解更多資訊。
🏆 WHATSAPP ME : wa.me/919455664601
🏆 MY TELEGRAM : t.me/hashtaghammer
🏆 MY BOOK ( TRADING IS AN EMOTION ) : tinyurl.com/TradingISanEMOTION
🏆 MY TELEGRAM : t.me/hashtaghammer
🏆 MY BOOK ( TRADING IS AN EMOTION ) : tinyurl.com/TradingISanEMOTION
相關出版品
免責聲明
這些資訊和出版物並非旨在提供,也不構成TradingView提供或認可的任何形式的財務、投資、交易或其他類型的建議或推薦。請閱讀使用條款以了解更多資訊。