
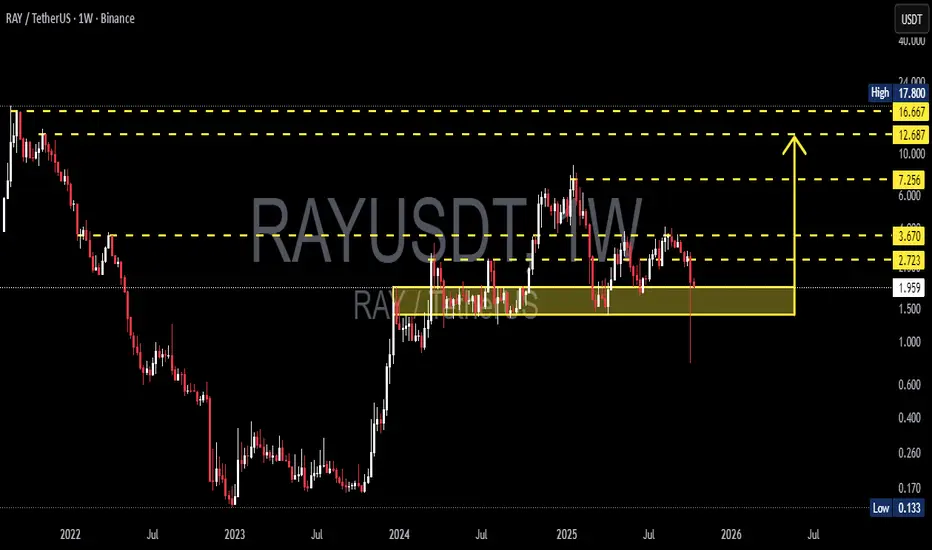
RAY is currently sitting at one of the most crucial structural zones, around the major support area of $1.50 – $1.96 (yellow box).
This area has acted as a key price pivot since mid-2024, where buyers and sellers have continuously battled for control.
After a sharp correction from the 2025 peak, price managed to hold above the main demand zone, with a long downside wick signaling liquidation or stop-hunt followed by immediate buying pressure.
This kind of reaction often represents a potential spring phase before a major trend reversal — if confirmed by a strong weekly close above support.
---
Structure & Pattern Analysis
Range Base / Accumulation Zone: The yellow block ($1.5 – $1.96) acts as a potential accumulation base, resembling a Wyckoff Accumulation pattern, where the spring phase (wick below support) might have just occurred.
Lower High Structure: The current structure still shows lower highs, but a confirmed higher low above $1.9 could signal a major trend reversal.
Key Resistance Levels: 2.72 – 3.67 – 7.25 – 12.68 – 16.66 – 17.80
→ These are progressive resistance targets for any mid-term bullish move.
---
Bullish Scenario
If RAY manages to close the weekly candle above $1.96 and hold, it would confirm:
A reclaim of the major demand zone.
Validation of the Wyckoff spring phase (accumulation completed).
The beginning of a mid-term trend reversal toward higher targets.
Bullish Targets:
1️⃣ $2.72 → First resistance / breakout trigger.
2️⃣ $3.67 → Range breakout confirmation.
3️⃣ $7.25 → Mid-term target zone (previous supply level).
A breakout with strong volume above $3.67 would likely trigger a larger markup phase, indicating the start of a new bullish cycle.
---
Bearish Scenario
If price fails to hold and closes weekly below $1.50, it would mean:
The main structural support has broken down.
Selling pressure could intensify toward $1.00 – $0.60.
In an extreme case, price might revisit its historical liquidity zone around $0.13.
Bearish Confirmation Signs:
Weekly close < $1.50.
Consecutive lower closes without recovery.
High-volume red candle (true capitulation, not just a sweep).
---
Technical Summary
RAY is standing at a macro decision zone — every upcoming weekly close will define whether:
The market is building a new base for the next bullish cycle,
or
Entering a continued bearish leg toward historical lows.
The area between $1.5–$1.9 is the “make or break zone.”
As long as the price doesn’t close below it, the mid-term bullish structure remains valid.
---
Trading Notes
Strong rejection candles within support = potential swing-buy opportunities (tight SL below wick).
Breakout above 2.72 with strong volume = confirmation for mid-term re-entry.
Be cautious of fakeouts — always wait for weekly candle closes before confirming bias.
---
#RAYUSDT #Raydium #CryptoAnalysis #WeeklyChart #MarketStructure #CryptoTechnical #SwingTrade #Wyckoff #DeFi #SupportZone #PriceAction #TrendReversal #AltcoinSetup #TradingViewAnalysis
This area has acted as a key price pivot since mid-2024, where buyers and sellers have continuously battled for control.
After a sharp correction from the 2025 peak, price managed to hold above the main demand zone, with a long downside wick signaling liquidation or stop-hunt followed by immediate buying pressure.
This kind of reaction often represents a potential spring phase before a major trend reversal — if confirmed by a strong weekly close above support.
---
Structure & Pattern Analysis
Range Base / Accumulation Zone: The yellow block ($1.5 – $1.96) acts as a potential accumulation base, resembling a Wyckoff Accumulation pattern, where the spring phase (wick below support) might have just occurred.
Lower High Structure: The current structure still shows lower highs, but a confirmed higher low above $1.9 could signal a major trend reversal.
Key Resistance Levels: 2.72 – 3.67 – 7.25 – 12.68 – 16.66 – 17.80
→ These are progressive resistance targets for any mid-term bullish move.
---
Bullish Scenario
If RAY manages to close the weekly candle above $1.96 and hold, it would confirm:
A reclaim of the major demand zone.
Validation of the Wyckoff spring phase (accumulation completed).
The beginning of a mid-term trend reversal toward higher targets.
Bullish Targets:
1️⃣ $2.72 → First resistance / breakout trigger.
2️⃣ $3.67 → Range breakout confirmation.
3️⃣ $7.25 → Mid-term target zone (previous supply level).
A breakout with strong volume above $3.67 would likely trigger a larger markup phase, indicating the start of a new bullish cycle.
---
Bearish Scenario
If price fails to hold and closes weekly below $1.50, it would mean:
The main structural support has broken down.
Selling pressure could intensify toward $1.00 – $0.60.
In an extreme case, price might revisit its historical liquidity zone around $0.13.
Bearish Confirmation Signs:
Weekly close < $1.50.
Consecutive lower closes without recovery.
High-volume red candle (true capitulation, not just a sweep).
---
Technical Summary
RAY is standing at a macro decision zone — every upcoming weekly close will define whether:
The market is building a new base for the next bullish cycle,
or
Entering a continued bearish leg toward historical lows.
The area between $1.5–$1.9 is the “make or break zone.”
As long as the price doesn’t close below it, the mid-term bullish structure remains valid.
---
Trading Notes
Strong rejection candles within support = potential swing-buy opportunities (tight SL below wick).
Breakout above 2.72 with strong volume = confirmation for mid-term re-entry.
Be cautious of fakeouts — always wait for weekly candle closes before confirming bias.
---
#RAYUSDT #Raydium #CryptoAnalysis #WeeklyChart #MarketStructure #CryptoTechnical #SwingTrade #Wyckoff #DeFi #SupportZone #PriceAction #TrendReversal #AltcoinSetup #TradingViewAnalysis

✅ Get Free Signals! Join Our Telegram Channel Here: t.me/TheCryptoNuclear
✅ Twitter: twitter.com/crypto_nuclear
✅ Join Bybit : partner.bybit.com/b/nuclearvip
✅ Benefits : Lifetime Trading Fee Discount -50%
✅ Twitter: twitter.com/crypto_nuclear
✅ Join Bybit : partner.bybit.com/b/nuclearvip
✅ Benefits : Lifetime Trading Fee Discount -50%
免責聲明
這些資訊和出版物並非旨在提供,也不構成TradingView提供或認可的任何形式的財務、投資、交易或其他類型的建議或推薦。請閱讀使用條款以了解更多資訊。
✅ Get Free Signals! Join Our Telegram Channel Here: t.me/TheCryptoNuclear
✅ Twitter: twitter.com/crypto_nuclear
✅ Join Bybit : partner.bybit.com/b/nuclearvip
✅ Benefits : Lifetime Trading Fee Discount -50%
✅ Twitter: twitter.com/crypto_nuclear
✅ Join Bybit : partner.bybit.com/b/nuclearvip
✅ Benefits : Lifetime Trading Fee Discount -50%
免責聲明
這些資訊和出版物並非旨在提供,也不構成TradingView提供或認可的任何形式的財務、投資、交易或其他類型的建議或推薦。請閱讀使用條款以了解更多資訊。