
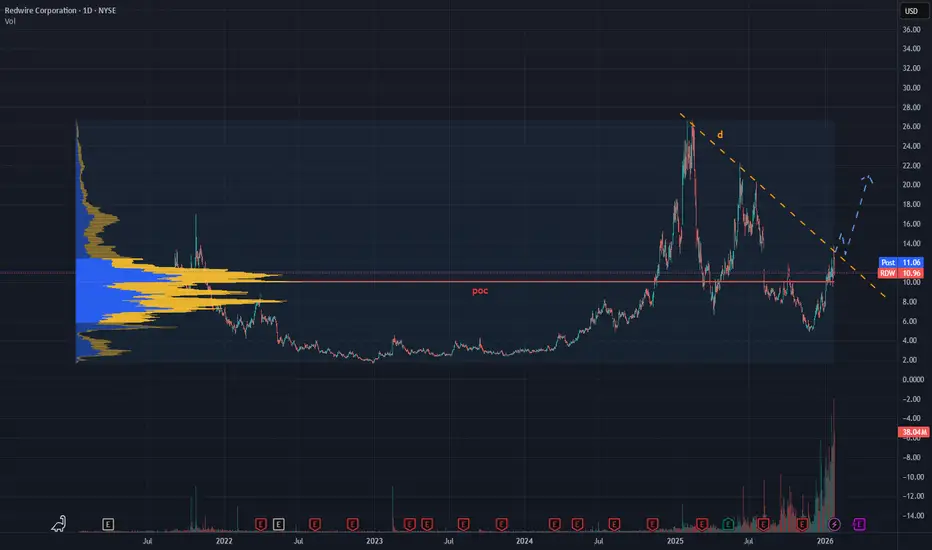
The stock RDW, which has been listed relatively recently, showed an interesting technical structure shortly after its IPO.
In the early trading phase, price action formed a classic Cup & Handle continuation pattern, later confirmed by a bullish breakout that led to a strong impulsive move, nearly doubling the price.

Market Structure
After setting a significant high, the stock entered a corrective phase, characterized by:
From a volume and market profile perspective:

Bullish Scenario
A long setup becomes technically valid only after a confirmed breakout above the daily descending trendline.
Key conditions:

⚠️ Trading Note
Until the bearish structure is broken, the stock remains in a corrective/consolidation phase.
A confirmed breakout would be the key signal to reassess bullish momentum and directional strength.
In the early trading phase, price action formed a classic Cup & Handle continuation pattern, later confirmed by a bullish breakout that led to a strong impulsive move, nearly doubling the price.
Market Structure
After setting a significant high, the stock entered a corrective phase, characterized by:
- lower highs
- lower lows
- a short- to medium-term bearish market structure
From a volume and market profile perspective:
- price is currently holding above the POC (Point of Control), a key level representing the area of highest traded volume
- the stock is trading just below a descending daily trendline, acting as a dynamic resistance
Bullish Scenario
A long setup becomes technically valid only after a confirmed breakout above the daily descending trendline.
Key conditions:
- clean breakout of the trendline
- decreasing or controlled volume, suggesting supply absorption rather than emotional buying
- potential retest of the broken trendline as dynamic support
⚠️ Trading Note
Until the bearish structure is broken, the stock remains in a corrective/consolidation phase.
A confirmed breakout would be the key signal to reassess bullish momentum and directional strength.

免責聲明
這些資訊和出版物並非旨在提供,也不構成TradingView提供或認可的任何形式的財務、投資、交易或其他類型的建議或推薦。請閱讀使用條款以了解更多資訊。
免責聲明
這些資訊和出版物並非旨在提供,也不構成TradingView提供或認可的任何形式的財務、投資、交易或其他類型的建議或推薦。請閱讀使用條款以了解更多資訊。