
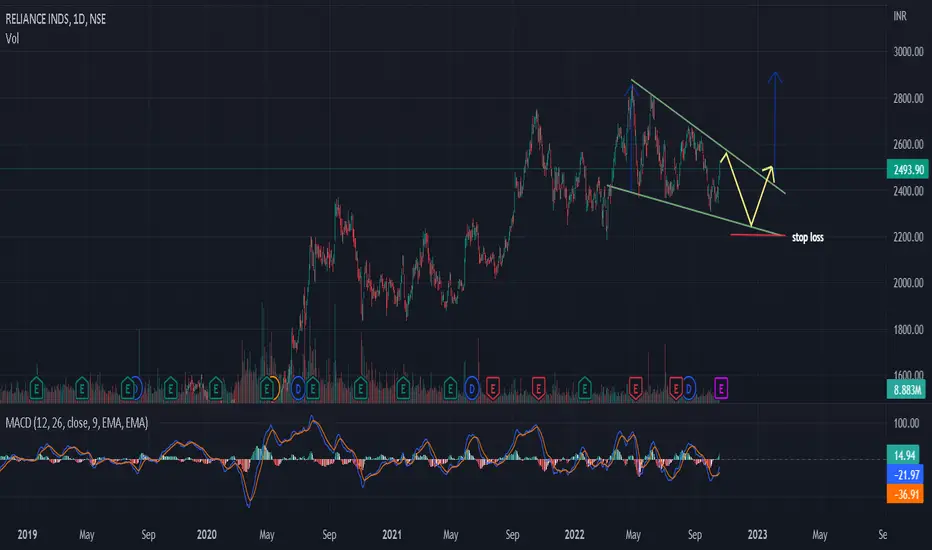
What we can see in the chart is a falling wedge pattern. Currently the price is inside the pattern. We are expecting the price to get rejected at the upper boundary of the wedge and come back down to retest the support. After that we are expecting the pump and the break out to the upside.
MACD has a bullish crossover which is positive sign for bulls.
The target and the stop loss are shown in the chart. Enter the trade only when/if the price breaks out with the volume surge.
MACD has a bullish crossover which is positive sign for bulls.
The target and the stop loss are shown in the chart. Enter the trade only when/if the price breaks out with the volume surge.

💥 Free signals and ideas ➡ t.me/vfinvestment
相關出版品
免責聲明
這些資訊和出版物並非旨在提供,也不構成TradingView提供或認可的任何形式的財務、投資、交易或其他類型的建議或推薦。請閱讀使用條款以了解更多資訊。
💥 Free signals and ideas ➡ t.me/vfinvestment
相關出版品
免責聲明
這些資訊和出版物並非旨在提供,也不構成TradingView提供或認可的任何形式的財務、投資、交易或其他類型的建議或推薦。請閱讀使用條款以了解更多資訊。