 RELIANCE
 Manual Backtesting Study | Supply–Demand • Pullbacks • Breakouts
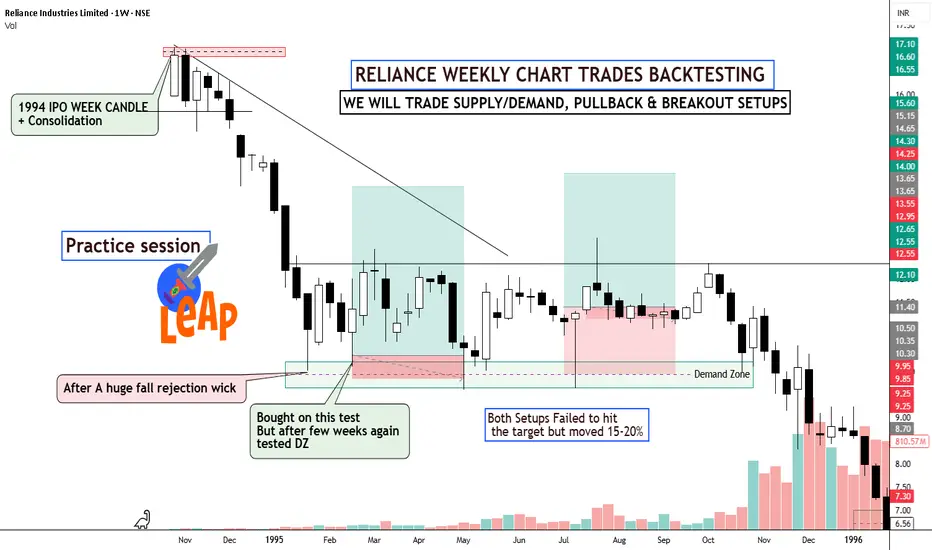
I started from the weekly timeframe and moved the chart candle by candle, exactly the way price unfolds in real time.
The goal was simple:
⦿Understand where institutions likely accumulated or distributed
⦿Observe how price reacts at supply & demand zones
⦿Track pullback behavior in strong trends
⦿Validate breakouts only when structure and context align
Read the study Chart by chart
1.
2.
3.
4.
5.
6.
7.
8.
9.
10.
11.
12.
13.
14.
15.
16.
17.
Keep Learning,
Happy Trading.
交易進行
Chart 17 we left it at the supply zone in few days it has fallen alot, the supply zone defended and it unfolded massive fall.
相關出版品
免責聲明
這些資訊和出版物並非旨在提供,也不構成TradingView提供或認可的任何形式的財務、投資、交易或其他類型的建議或推薦。請閱讀使用條款以了解更多資訊。