
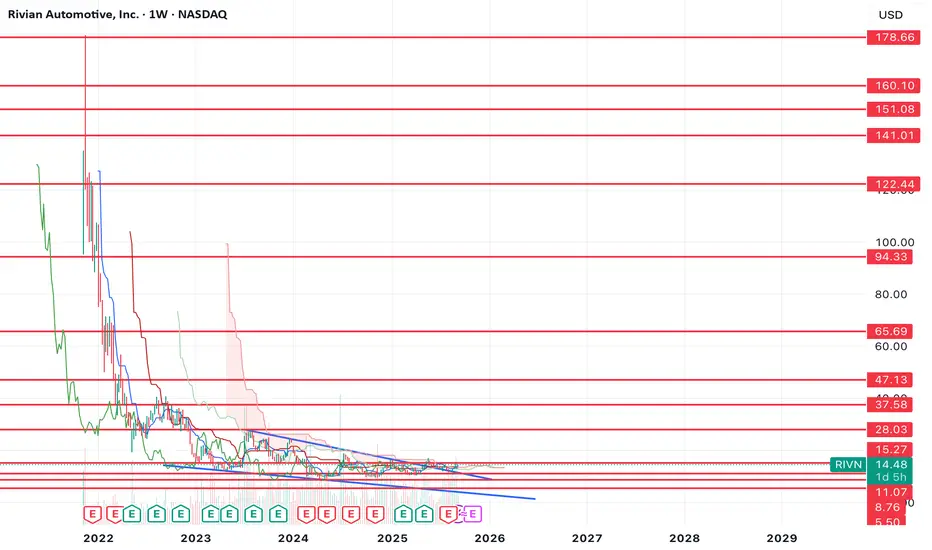
The RIVN chart is starting to look good here. As you can see from the chart, we've broken out of a falling wedge. The next challenge is for price to flip the $15.27 resistance level as support and retest it.
If it can do that, then I think we can start to see a sustained uptrend. If it tests $15.27 or briefly breaks above it and rejects, then I think there's a possibility of one more retest of the lows prior to the move starting.
That said, the chart is starting to look really good over the long term. I think this has 10X+ potential over the coming years.
If it can do that, then I think we can start to see a sustained uptrend. If it tests $15.27 or briefly breaks above it and rejects, then I think there's a possibility of one more retest of the lows prior to the move starting.
That said, the chart is starting to look really good over the long term. I think this has 10X+ potential over the coming years.

免責聲明
這些資訊和出版物並非旨在提供,也不構成TradingView提供或認可的任何形式的財務、投資、交易或其他類型的建議或推薦。請閱讀使用條款以了解更多資訊。