
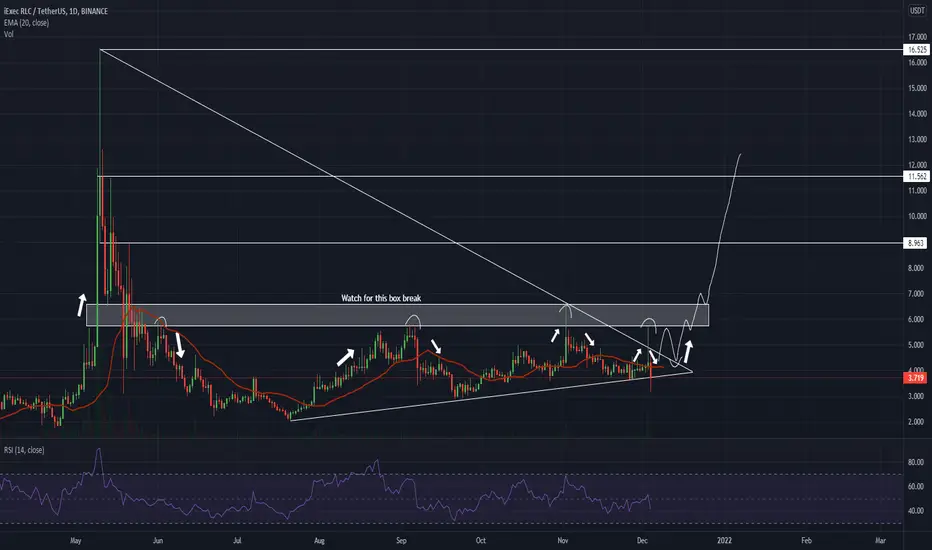
After RLCUSDT went parabolic and made an ATH, it has made several attempts to recreate the move or even go further to the new price discovery. I found a crucial resistance which is showed as a white box in the chart. Yesterday RLCUSDT looked really strong, but got rejected again. If it stays withing the ranges of triangle today, I think there is a great chance of testing the white box of resistance again, or even breaking out of it. I tried to draw a possible situation how I would see it happening.
取消訂單

免責聲明
這些資訊和出版物並非旨在提供,也不構成TradingView提供或認可的任何形式的財務、投資、交易或其他類型的建議或推薦。請閱讀使用條款以了解更多資訊。