做多
RNDR: Descending Triangle Breakout
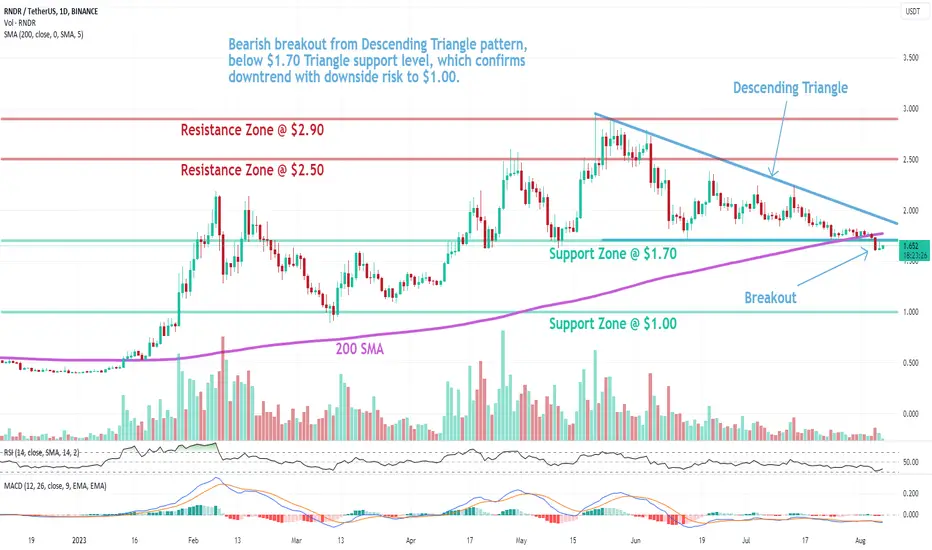
Trade setup: Bearish breakout from Descending Triangle pattern, below $1.70 Triangle support level, which confirms downtrend with downside risk to $1.00.
Pattern: Price was trading in a Descending Triangle pattern. Typically, a breakout will typically occur in the direction of the existing trend. Most traders will take a position once the price action breaks through the bottom line of the triangle with increased volume, which is when the price should decline an amount equivalent to the widest section of the triangle.
Trend: Downtrend on Short- and Medium-Term basis and Neutral on Long-Term basis.
Momentum is Bearish (MACD Line is below MACD Signal Line, and RSI is below 45).
Support and Resistance: Nearest Support Zone is $1.70, which it broke, then $1.00. The nearest Resistance Zone is $2.50, then $2.90.

免責聲明
這些資訊和出版物並非旨在提供,也不構成TradingView提供或認可的任何形式的財務、投資、交易或其他類型的建議或推薦。請閱讀使用條款以了解更多資訊。