
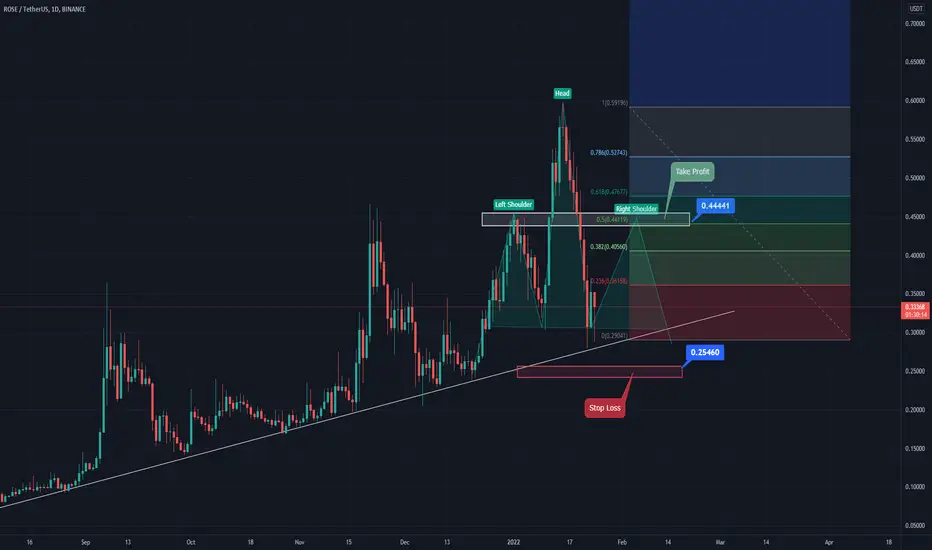
We see on this ROSEUSDT daily chart that the price respected that strong trend line, cause we see a rejection when the price touched that line after an accelerated downtrend, if you go back to the 4h frame you will see a clear rejection from that trendline, also we can easily recognize the head and shoulder pattern, so to get more confirmation we saw that the right shoulder meet the 50% Fibonacci retracement level.

免責聲明
這些資訊和出版物並非旨在提供,也不構成TradingView提供或認可的任何形式的財務、投資、交易或其他類型的建議或推薦。請閱讀使用條款以了解更多資訊。