
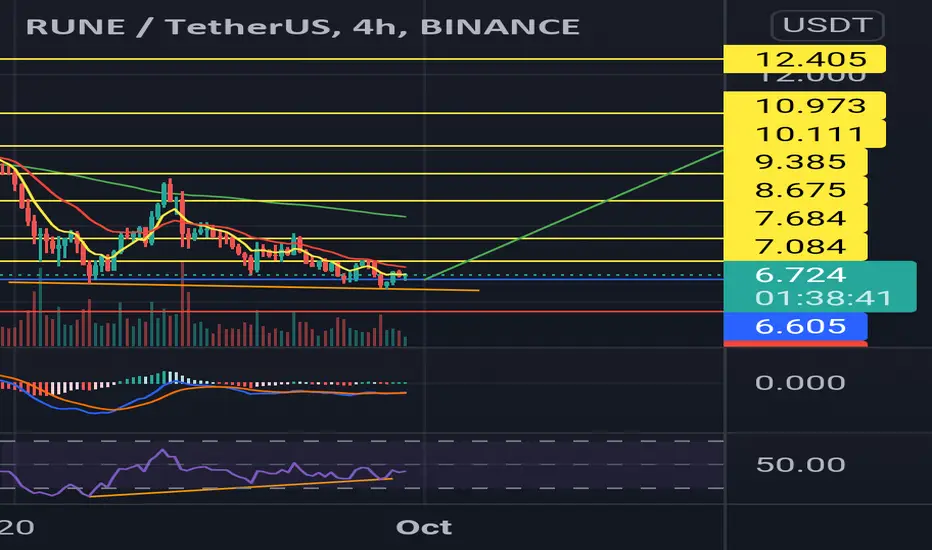
The blue line is my entry target when i saw RUNE chart this morning and it's filled nicely, while i hope RUNE can gain more traction while BTC's price is recovery and trying save the position above EMA21 Weekly chart.
In RUNE chart i saw a slight bullish divergence, hope for the best RUNE can reach the top
Yellow line is the price target
The red line is the stop loss
If you have some ideas about RUNE or BTC price movement , I'm happy to know it.
TIA
In RUNE chart i saw a slight bullish divergence, hope for the best RUNE can reach the top
Yellow line is the price target
The red line is the stop loss
If you have some ideas about RUNE or BTC price movement , I'm happy to know it.
TIA

免責聲明
這些資訊和出版物並非旨在提供,也不構成TradingView提供或認可的任何形式的財務、投資、交易或其他類型的建議或推薦。請閱讀使用條款以了解更多資訊。