Daily
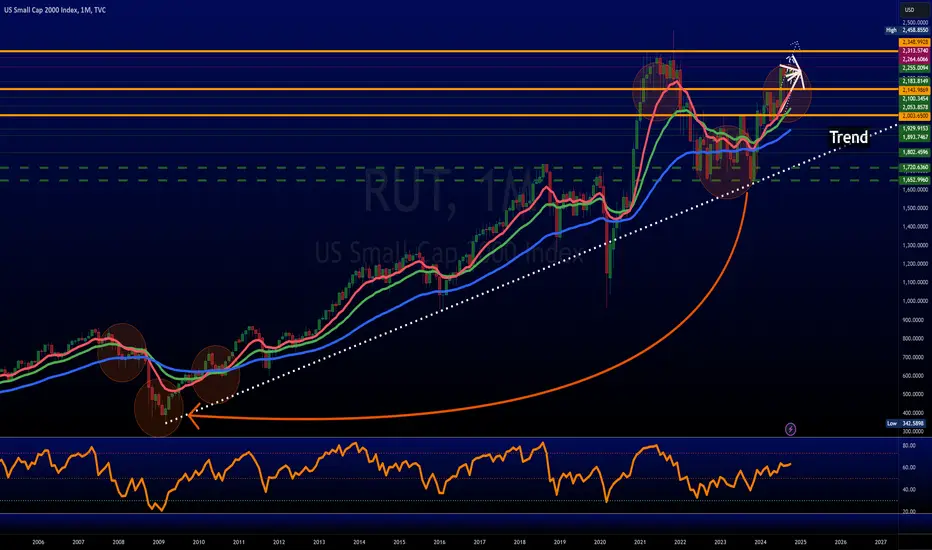
The RUT looks okay, slowly grinding higher.
Spreading the chart out, it's still forming the, usually bullish, Inverse Head & Shoulder pattern.
Had this on a daily & weekly but the chart we see here is for the monthly (see profile for more info on where to get more data)
it is easier to see the pattern on the Weekly chart. Interesting.
However, we see something interesting on a monthly.
Monthly it looks similar to 2008 to 2010
 IWM
IWM
The
RUT looks okay, slowly grinding higher.Spreading the chart out, it's still forming the, usually bullish, Inverse Head & Shoulder pattern.
Had this on a daily & weekly but the chart we see here is for the monthly (see profile for more info on where to get more data)
it is easier to see the pattern on the Weekly chart. Interesting.
However, we see something interesting on a monthly.
Monthly it looks similar to 2008 to 2010
IWM
免責聲明
這些資訊和出版物並非旨在提供,也不構成TradingView提供或認可的任何形式的財務、投資、交易或其他類型的建議或推薦。請閱讀使用條款以了解更多資訊。
免責聲明
這些資訊和出版物並非旨在提供,也不構成TradingView提供或認可的任何形式的財務、投資、交易或其他類型的建議或推薦。請閱讀使用條款以了解更多資訊。