
Technical Analysis
Invalidation: A decisive breakdown below key support zone weakens the Wave 4 scenario.
Fundamental View

Verdict
Disclaimer: This analysis is for educational purposes only and does not constitute investment advice. Please do your own research (DYOR) before making any trading decisions.
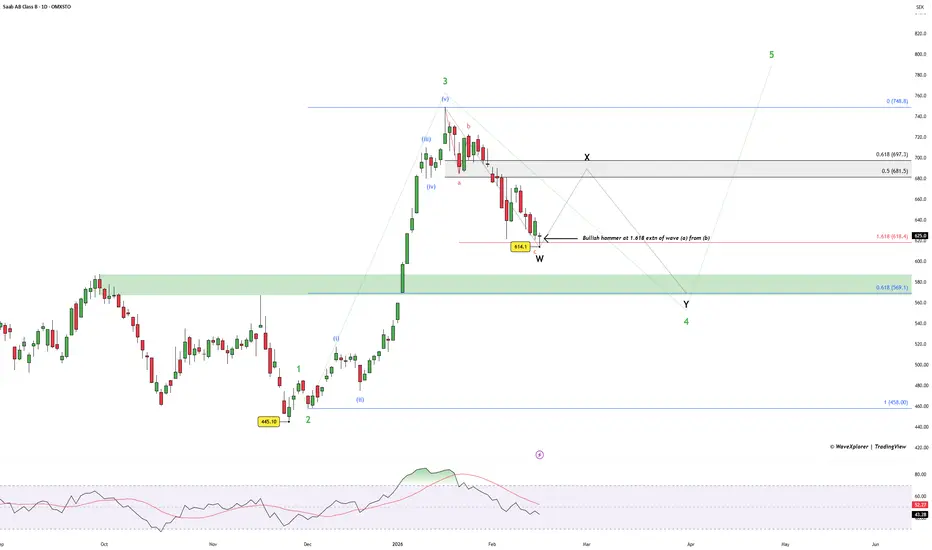
- From the lows at 445.10, Saab AB advanced in a strong impulsive structure forming a 1-2, 1-2 setup and extending into a powerful higher degree Wave 3, topping near 748.8.
- Post that high, price has corrected in what appears to be an ABC zigzag, with Wave C reaching the 1.618 Fibonacci extension of Wave A from B near 641.
- A bullish hammer has formed at this zone, hinting at a potential short-term reversal.
- If 641 holds, we may see an X connector rally toward the 0.5–0.618 retracement zone of Wave W between 681.5–697.3.
- After that, a possible final Wave Y decline could unfold toward 569.1, which aligns with the 0.618 retracement of the entire Wave 3 rally and a broader support cluster.
- Completion of this correction may set the stage for Wave 5, potentially pushing price beyond 748.8 toward 800+ SEK.
Invalidation: A decisive breakdown below key support zone weakens the Wave 4 scenario.
Fundamental View
- Revenue has grown strongly over recent years, especially post-2022. Free cash flow remains positive though volatile.
- Operating margins and ROCE are trending higher, showing improving efficiency and capital usage.
- However, long-term debt has increased and valuation remains stretched with a P/E around the mid-50s.
- This is not a cheap stock. It is priced for continued strong growth.
Verdict
- Technically, Saab appears to be developing a Wave 4 correction within a larger bullish structure.
- Fundamentally, the company is solid — but expensive.
- If support holds and structure confirms, the larger trend remains bullish.
- If growth slows or support breaks, downside risk expands quickly.
Disclaimer: This analysis is for educational purposes only and does not constitute investment advice. Please do your own research (DYOR) before making any trading decisions.

WaveXplorer | Elliott Wave insights
📊 X profile: @veerappa89
📊 X profile: @veerappa89
相關出版品
免責聲明
這些資訊和出版物並非旨在提供,也不構成TradingView提供或認可的任何形式的財務、投資、交易或其他類型的建議或推薦。請閱讀使用條款以了解更多資訊。
WaveXplorer | Elliott Wave insights
📊 X profile: @veerappa89
📊 X profile: @veerappa89
相關出版品
免責聲明
這些資訊和出版物並非旨在提供,也不構成TradingView提供或認可的任何形式的財務、投資、交易或其他類型的建議或推薦。請閱讀使用條款以了解更多資訊。