
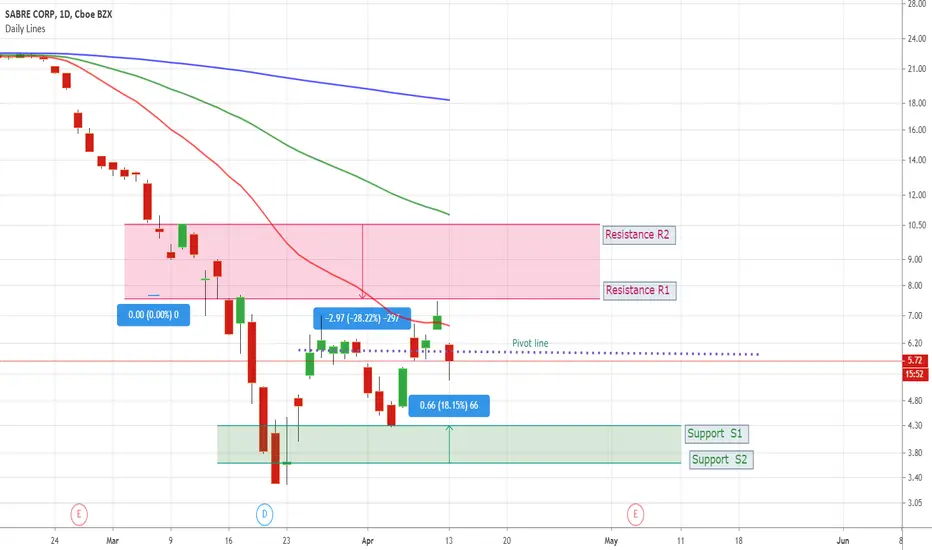
SABR S1/S2 and R1/R2 with Pivot line based on my own analysis
These S/R lines are NOT the calculated standard formula Support and Resistance levels.
These are based on reading and my own analysis of the Price action over last 2 weeks.
Pivot Line is the Line where SABR price action 'pass thru' MOST candles bars in the last 2 weeks .
My analysis is that these S/R lines are good for 'next 10 trading days '
These S/R lines are NOT the calculated standard formula Support and Resistance levels.
These are based on reading and my own analysis of the Price action over last 2 weeks.
Pivot Line is the Line where SABR price action 'pass thru' MOST candles bars in the last 2 weeks .
My analysis is that these S/R lines are good for 'next 10 trading days '

免責聲明
這些資訊和出版物並非旨在提供,也不構成TradingView提供或認可的任何形式的財務、投資、交易或其他類型的建議或推薦。請閱讀使用條款以了解更多資訊。
免責聲明
這些資訊和出版物並非旨在提供,也不構成TradingView提供或認可的任何形式的財務、投資、交易或其他類型的建議或推薦。請閱讀使用條款以了解更多資訊。