
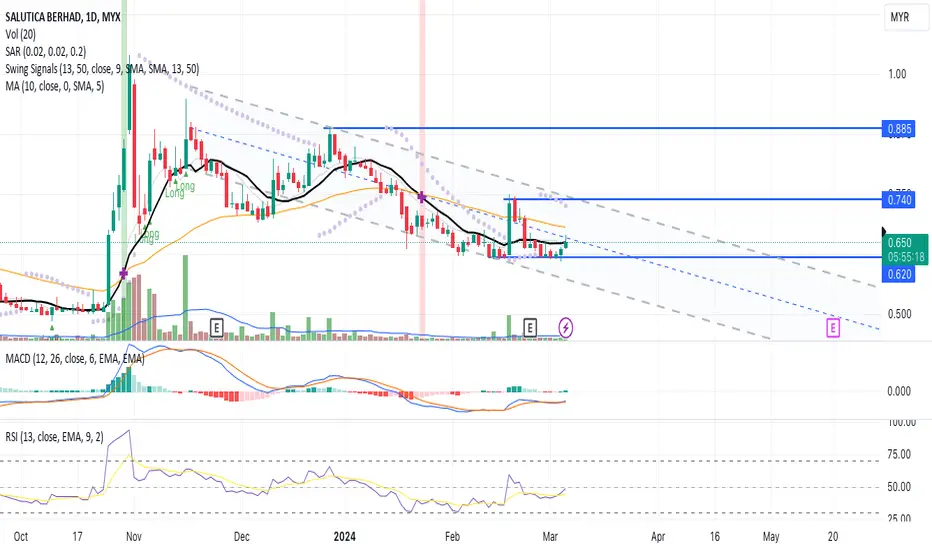
The candlestick pattern indicates a reversal pattern where the price having a positive momentum towards the MA line without significant in trading volume. Therefore, a precaution for a potenticial price reversal.
The price channel indicator provide the upper and lower bound of the price range during a market trend. The indicator uses the highest highs and lowest lows to form the channel, with the upper and lower lines representing support and resistance areas
MACD and RSI indicate a positive signal hence confirming the price momemtum towards next price resistance.
Let's SALUTE in WL and watch out for price uptrend towards next price peak resistance with result in volume above the MA line.
R 0.740
S 0.620
The price channel indicator provide the upper and lower bound of the price range during a market trend. The indicator uses the highest highs and lowest lows to form the channel, with the upper and lower lines representing support and resistance areas
MACD and RSI indicate a positive signal hence confirming the price momemtum towards next price resistance.
Let's SALUTE in WL and watch out for price uptrend towards next price peak resistance with result in volume above the MA line.
R 0.740
S 0.620

免責聲明
這些資訊和出版物並非旨在提供,也不構成TradingView提供或認可的任何形式的財務、投資、交易或其他類型的建議或推薦。請閱讀使用條款以了解更多資訊。
免責聲明
這些資訊和出版物並非旨在提供,也不構成TradingView提供或認可的任何形式的財務、投資、交易或其他類型的建議或推薦。請閱讀使用條款以了解更多資訊。