
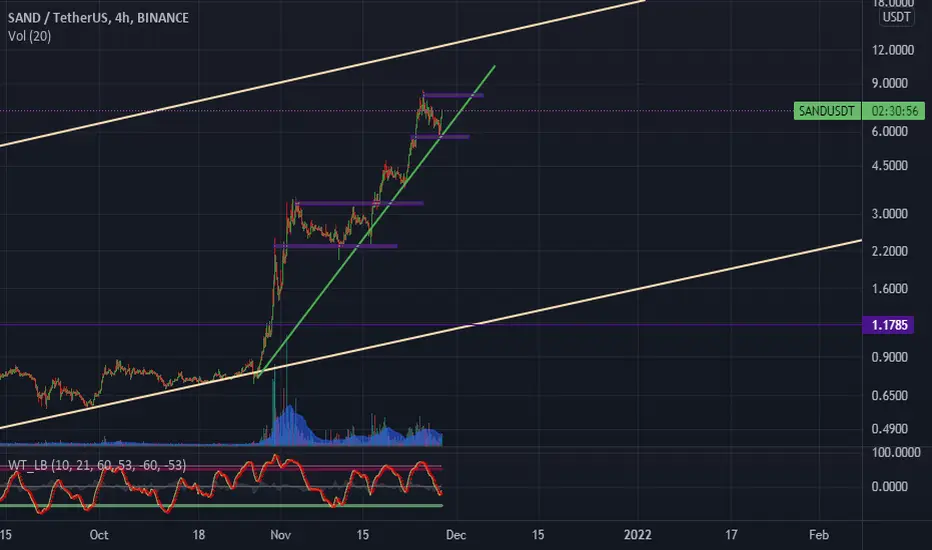
sand usdt analyses
time frame 4 Hours
we can see green uptrend line( short term) between two creme uptrend line (long term)
we can see when price hits green line , price reacts and grows
also we can see when wave is going up in indicator in bottom of chart . when price hit the green line
sorry for my very very bad English but I hope it was useful for you

免責聲明
這些資訊和出版物並非旨在提供,也不構成TradingView提供或認可的任何形式的財務、投資、交易或其他類型的建議或推薦。請閱讀使用條款以了解更多資訊。
免責聲明
這些資訊和出版物並非旨在提供,也不構成TradingView提供或認可的任何形式的財務、投資、交易或其他類型的建議或推薦。請閱讀使用條款以了解更多資訊。