
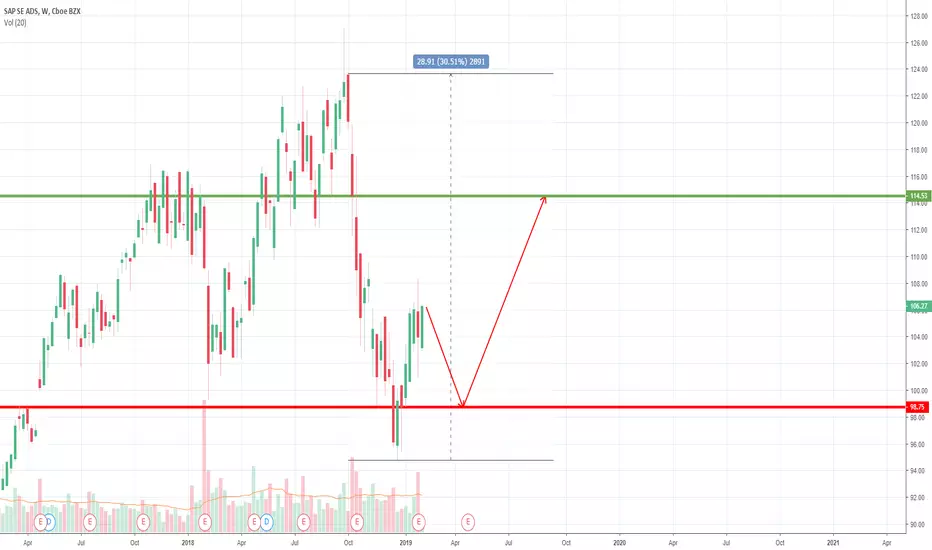
Bearish in short run -to bonce back to around 113 - 114.
Period from: Feb 5 - Sept 20th
Why: When looking at the six month chart it waffles before trending upward or downward. The waffles have become larger. By placing indicators at the end of large buys and sells, this gives you a range of how far the next break out is going to go.
Period from: Feb 5 - Sept 20th
Why: When looking at the six month chart it waffles before trending upward or downward. The waffles have become larger. By placing indicators at the end of large buys and sells, this gives you a range of how far the next break out is going to go.

免責聲明
這些資訊和出版物並非旨在提供,也不構成TradingView提供或認可的任何形式的財務、投資、交易或其他類型的建議或推薦。請閱讀使用條款以了解更多資訊。
免責聲明
這些資訊和出版物並非旨在提供,也不構成TradingView提供或認可的任何形式的財務、投資、交易或其他類型的建議或推薦。請閱讀使用條款以了解更多資訊。