
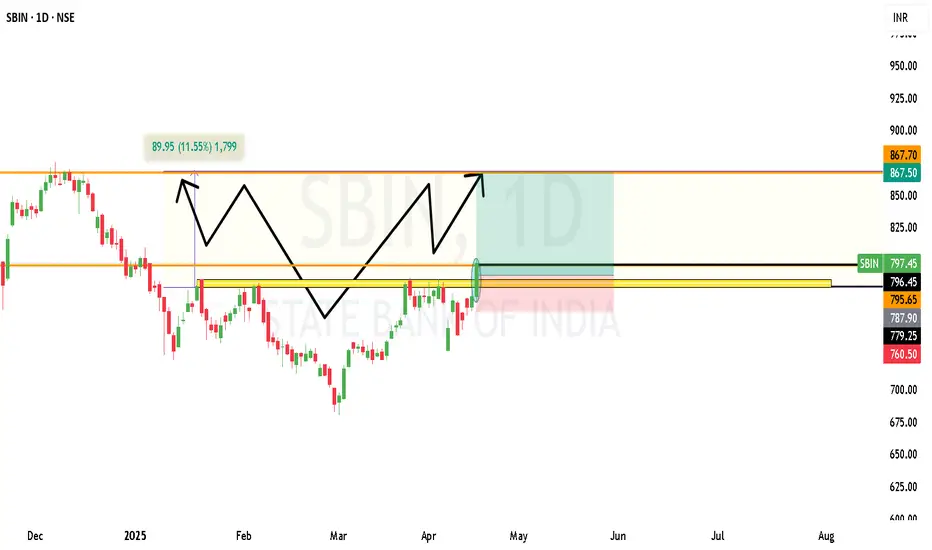
Exciting pattern on SBIN(State Bank Of India) chart!
Validation of my target:
1. Inverted Head & Shoulder pattern confirmed on daily chart.
2. Neckline breakout already happened @ 822
3. Target Calculation: Neckline + (Neckline - head low)
Approx. 874,
4. Technical Indicator also supportive
*RSI trending up from oversold zone
* MACD crossover happened recently.
Target will range between 10 points 864 to 874.
Risk to reward is 1:3
Stop Loss previous low 760
For Educational purpose only

免責聲明
這些資訊和出版物並非旨在提供,也不構成TradingView提供或認可的任何形式的財務、投資、交易或其他類型的建議或推薦。請閱讀使用條款以了解更多資訊。
免責聲明
這些資訊和出版物並非旨在提供,也不構成TradingView提供或認可的任何形式的財務、投資、交易或其他類型的建議或推薦。請閱讀使用條款以了解更多資訊。