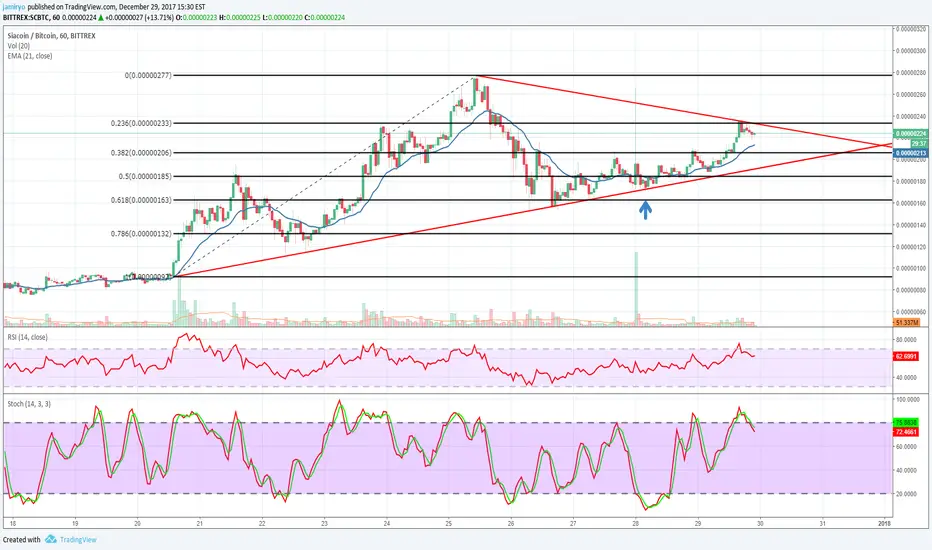
Possible support and resistance are marked in the graph. looks like it is in a downtrend for short term interval.
If it stays above the blue EMA, I think there is no big problem.
If it can break the triangles above resistance (red line) target will be 277 to make a cup formation.
If it stays above the blue EMA, I think there is no big problem.
If it can break the triangles above resistance (red line) target will be 277 to make a cup formation.
註釋
it broke the triangle, now it is on the pull back zone. it turned from the 233 level to take the pull back action. this prices are important I think. Must stay above the trend support zone (red line marked with blue arrow) for the upward movement.
交易進行
It looks like that it is moving in a horizontal channel between 206 and 233.I think the break point of this channel will show us the direction of the move. Indicators shows that it is looking to find a direction to itself.

免責聲明
這些資訊和出版物並非旨在提供,也不構成TradingView提供或認可的任何形式的財務、投資、交易或其他類型的建議或推薦。請閱讀使用條款以了解更多資訊。