
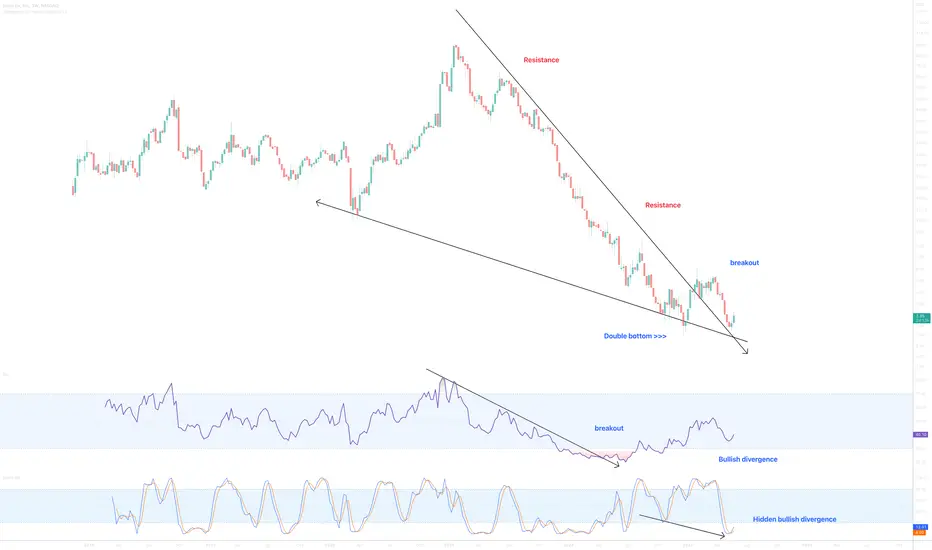
On the above weekly chart price action has corrected 97% since the sell signal printed in February 2021. A number of reasons now exist to have a long position, including:
1) You know why..
2) Price action and RSI resistance breakouts.
3) Price action prints a double with higher lows in RSI.
4) Stochastic RSI prints hidden bullish divergence, fantastic.
5) No stock splits.
Is it possible price action falls further? Sure.
Is it probable? No.
Ww
Type: investment
Risk: <=6% of portfolio
Timeframe: Don’t know.
Return: Will say somewhere else
Stop loss: <= 2.40
交易進行
Support on past resistance now confirmed.註釋
GRM support confirmed註釋
breakout! Hold it until 100+ dollars交易進行
註釋
resistance breakout 註釋
Past resistance confirms support.
免責聲明
這些資訊和出版物並非旨在提供,也不構成TradingView提供或認可的任何形式的財務、投資、交易或其他類型的建議或推薦。請閱讀使用條款以了解更多資訊。
免責聲明
這些資訊和出版物並非旨在提供,也不構成TradingView提供或認可的任何形式的財務、投資、交易或其他類型的建議或推薦。請閱讀使用條款以了解更多資訊。