做多
Sibanye
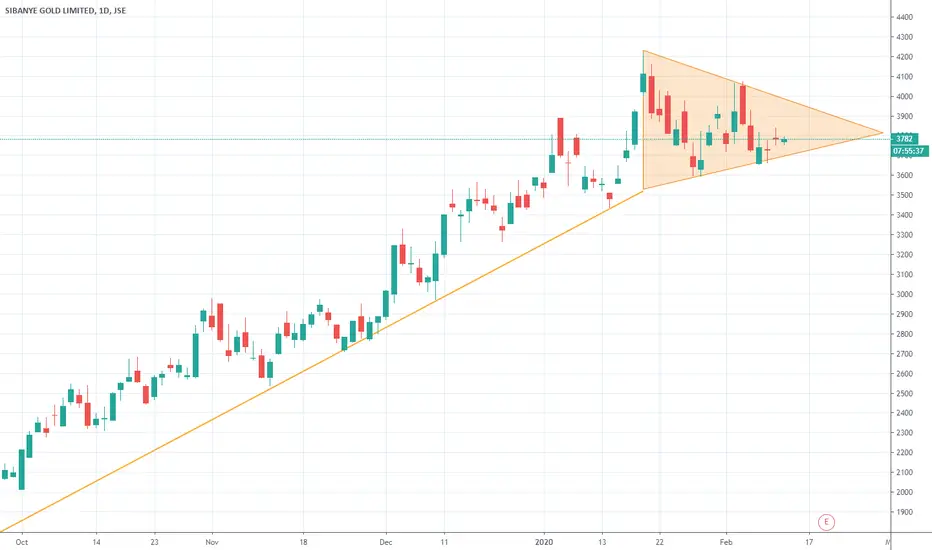
The share price of Sibanye has moved into a triangle shaped consolidation. The consolidation follows the strong uptrend we have seen on the stock. The triangle consolidation alludes to a short pause in the trend before this trend is continued. A close above resistance at 4040 would consider an upside breakout, confirming the pattern and continuation of the uptrend. In this scenario, traders might look for a move higher proportionate to the height of the triangle pattern. A close below the lower level of triangle support would suggest the failure of the move.
A close below the 3650 level would instead consider a downside breakout, suggesting a reversal of the preceding uptrend. As triangles are more commonly thought to be continuation patterns, a downside breakout would not be considered a favourable trading scenario (unlike the upside breakout scenario highlighted above).
A close below the 3650 level would instead consider a downside breakout, suggesting a reversal of the preceding uptrend. As triangles are more commonly thought to be continuation patterns, a downside breakout would not be considered a favourable trading scenario (unlike the upside breakout scenario highlighted above).
交易結束:目標達成

免責聲明
這些資訊和出版物並非旨在提供,也不構成TradingView提供或認可的任何形式的財務、投資、交易或其他類型的建議或推薦。請閱讀使用條款以了解更多資訊。
免責聲明
這些資訊和出版物並非旨在提供,也不構成TradingView提供或認可的任何形式的財務、投資、交易或其他類型的建議或推薦。請閱讀使用條款以了解更多資訊。