做多
$SHOP Towards $70
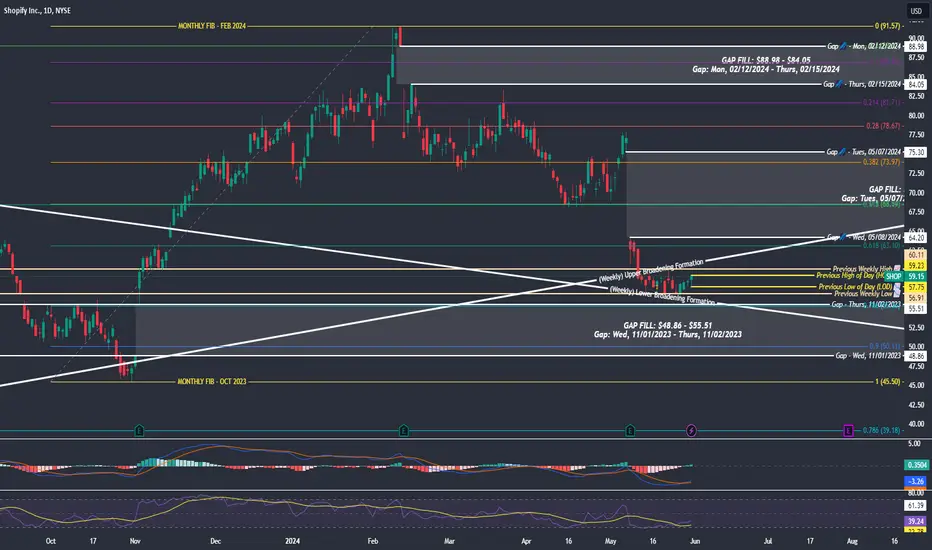
What do we see here?
- $NYSE:SHOP ended the day with a bullish outside day.
- Previous HOD for May 31 is $59.23, can serve as resistance.
- Previous weekly high is $60.11 and can also serve as resistance.
- GAP to be filled to the upside $64.20 - $75.30.
- RSI is at 39.24 and moving upwards slowly.
- MACD (blue line) is above the signal (orange line), indicates continued bullish movement
- 5-month monthly fibonacci patterns highlights potential resistance on 0.618 ($63.10) and 0.5 ($68.54) (which is the 0.618 of a bullish fib pattern on a larger time block
- GAP also potentially to be filled to the downside $55.51 - $48.86)

免責聲明
這些資訊和出版物並非旨在提供,也不構成TradingView提供或認可的任何形式的財務、投資、交易或其他類型的建議或推薦。請閱讀使用條款以了解更多資訊。