做空
SHOP- rectangle pattern - short
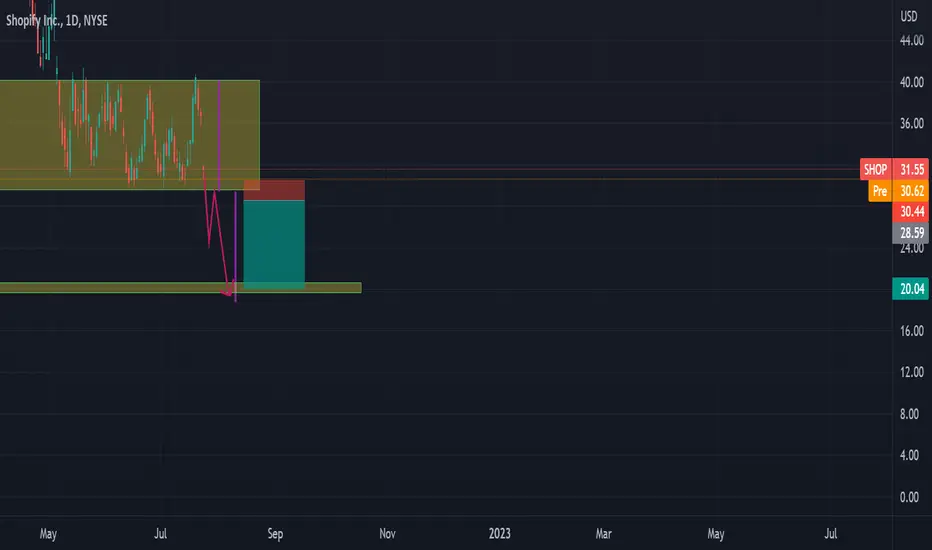
Shopify stock is in the range . It looks like the price is creating a rectangle pattern which may break to the downside.
Enter the trade if the price breaks below the rectangle and it retests the bottom of the rectangle as a resistance .
Target and the stop loss are shown in the chart.
Enter the trade if the price breaks below the rectangle and it retests the bottom of the rectangle as a resistance .
Target and the stop loss are shown in the chart.

💥 Free signals and ideas ➡ t.me/vfinvestment
免責聲明
這些資訊和出版物並非旨在提供,也不構成TradingView提供或認可的任何形式的財務、投資、交易或其他類型的建議或推薦。請閱讀使用條款以了解更多資訊。
💥 Free signals and ideas ➡ t.me/vfinvestment
免責聲明
這些資訊和出版物並非旨在提供,也不構成TradingView提供或認可的任何形式的財務、投資、交易或其他類型的建議或推薦。請閱讀使用條款以了解更多資訊。