
The primary trend (weekly TF) of Silver turned bearish since the beginning of the year.
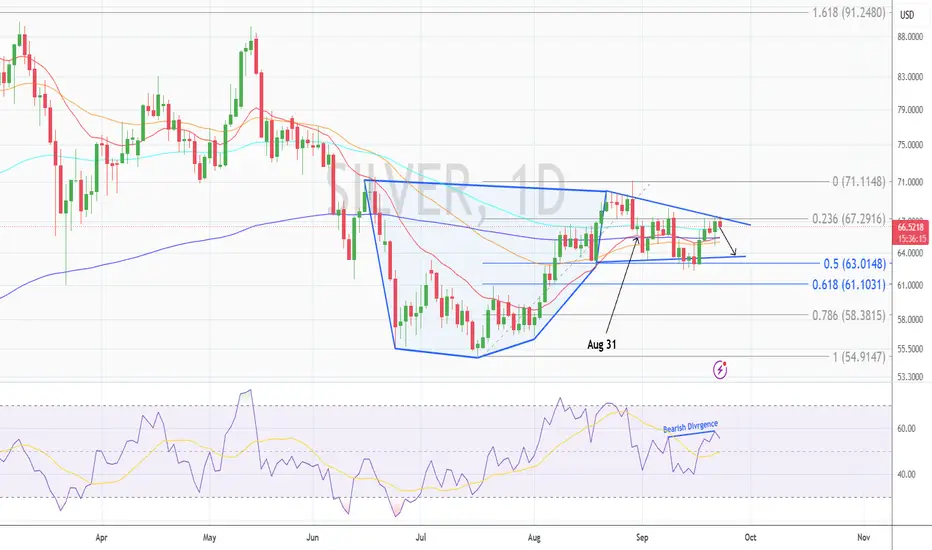
On a daily chart, silver is forming a cup & handle pattern, and prices are testing a confluence of resistance while trending within the handle of the pattern:
1. The upper zone of he handle
2. The fib level 0.236 (67.30) - this level is acting as strong resistance as prices failed to give a higher close since Aug 31.
RSI is also forming a bearish divergence with the prices.
Overall, prices are expected to decline at least till the EMA cluster (~65.30) or lower towards the lower territory of the handle near fib level 0.5 (63.00)
Alternative Scenario:
- The prices recently rose, taking support of the fib level 0.50 (63.00), and rose above the EMA cluster.
- But only a breakout above the fib level 0.236 (67.30) and above the handle will decisively drive prices to higher resistance levels
On a daily chart, silver is forming a cup & handle pattern, and prices are testing a confluence of resistance while trending within the handle of the pattern:
1. The upper zone of he handle
2. The fib level 0.236 (67.30) - this level is acting as strong resistance as prices failed to give a higher close since Aug 31.
RSI is also forming a bearish divergence with the prices.
Overall, prices are expected to decline at least till the EMA cluster (~65.30) or lower towards the lower territory of the handle near fib level 0.5 (63.00)
Alternative Scenario:
- The prices recently rose, taking support of the fib level 0.50 (63.00), and rose above the EMA cluster.
- But only a breakout above the fib level 0.236 (67.30) and above the handle will decisively drive prices to higher resistance levels

免責聲明
這些資訊和出版物並非旨在提供,也不構成TradingView提供或認可的任何形式的財務、投資、交易或其他類型的建議或推薦。請閱讀使用條款以了解更多資訊。
免責聲明
這些資訊和出版物並非旨在提供,也不構成TradingView提供或認可的任何形式的財務、投資、交易或其他類型的建議或推薦。請閱讀使用條款以了解更多資訊。