
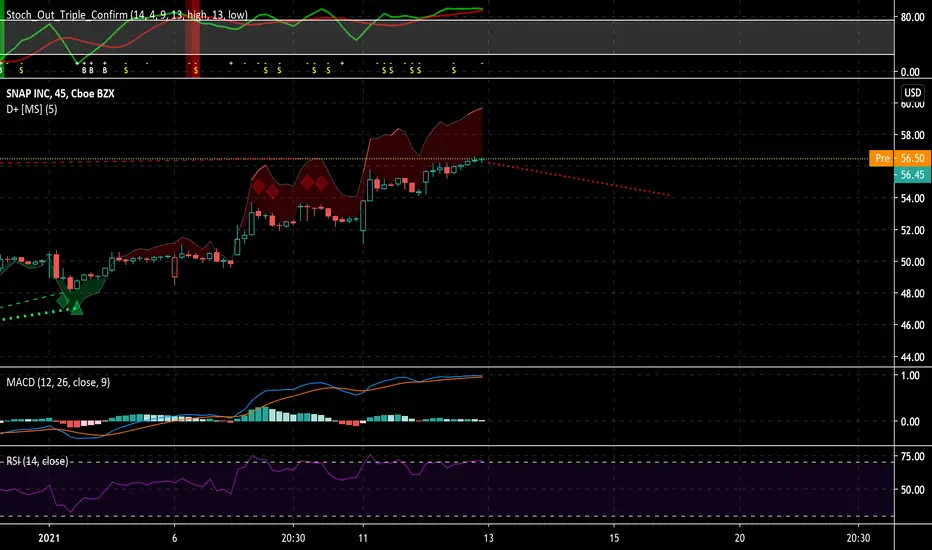
Snapchat is overbought in the short term and indicators are showing a steep decline.
First: MACD shows weakening bullish divergence
Second: D+ shows high levels of bearish divergence
Third: RSI is 71.62 indicating that the stock is overbought
Fourth: Candle bodies are getting smaller as price increases showing that bullish volume is decreasing as price increase, and in order for bullish volume to increase, price needs to decrease.
Think of SNAP needing a mini correction. I believe we will see this correction during the second half of the week.
Comment your thoughts below! Leave a like if you agree and make sure to follow

免責聲明
這些資訊和出版物並非旨在提供,也不構成TradingView提供或認可的任何形式的財務、投資、交易或其他類型的建議或推薦。請閱讀使用條款以了解更多資訊。
免責聲明
這些資訊和出版物並非旨在提供,也不構成TradingView提供或認可的任何形式的財務、投資、交易或其他類型的建議或推薦。請閱讀使用條款以了解更多資訊。