
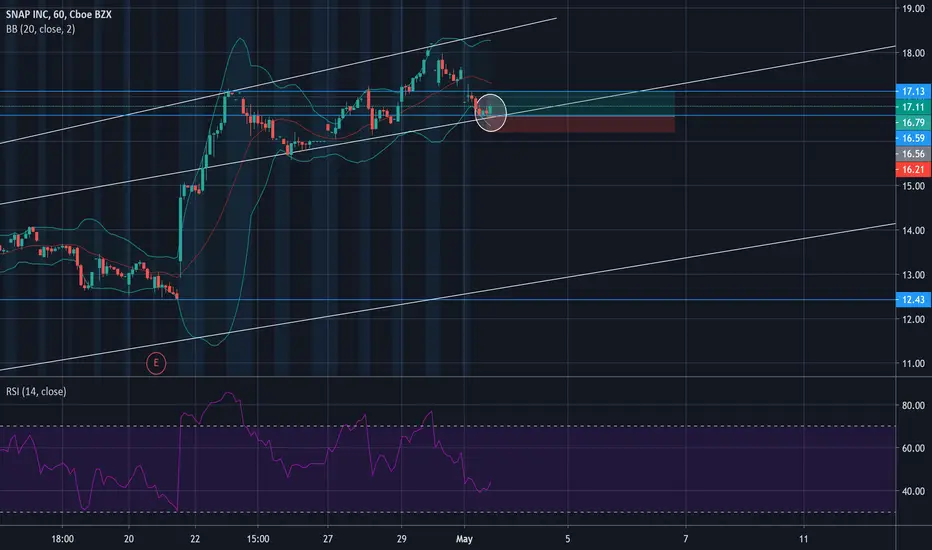
This one is tricky.
1) There is a big engulfing candlestick, which suggests that there will be an up movement, you could take this long position and make your profit just on the above resistance ($17.13).
2) wait to see what happens when it reaches that resistance ($17.13) :
if it fails to break out, there is will be ahead and shoulder pattern suggesting a change in momentum, you can short it then.
3) Bollinger band are suggesting a move upward
1) There is a big engulfing candlestick, which suggests that there will be an up movement, you could take this long position and make your profit just on the above resistance ($17.13).
2) wait to see what happens when it reaches that resistance ($17.13) :
if it fails to break out, there is will be ahead and shoulder pattern suggesting a change in momentum, you can short it then.
3) Bollinger band are suggesting a move upward
交易結束:目標達成
I'm closing this since it reached $17.16 today what I had expected ($17.13)
免責聲明
這些資訊和出版物並非旨在提供,也不構成TradingView提供或認可的任何形式的財務、投資、交易或其他類型的建議或推薦。請閱讀使用條款以了解更多資訊。