
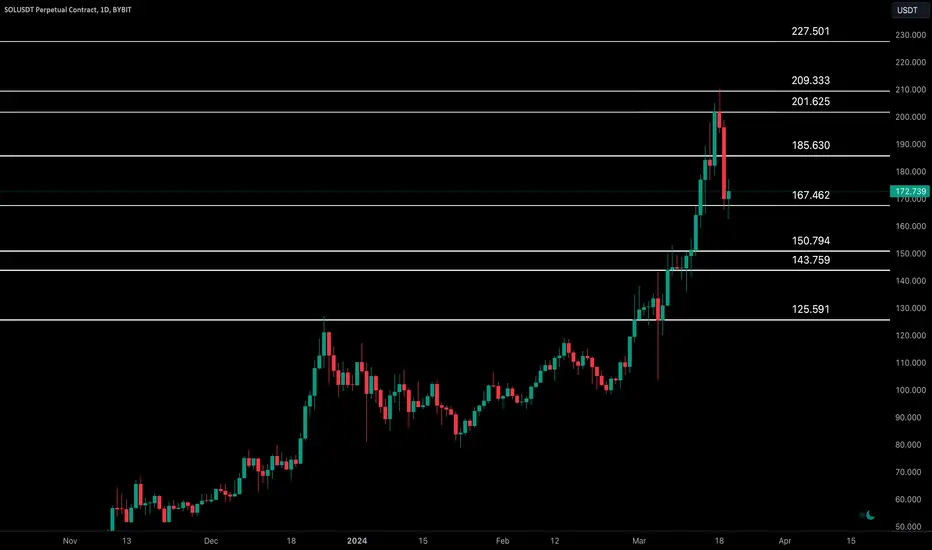
In the daily chart, Solana found a support at $167.
A daily candle closure above $186 will push Solana price towards the key Cryptolean resistance zone of $202-$209 and, possibly, higher.
An inability to sustain the price action above $167 will result in price declining towards $144-$151 the key daily support.
Intraday Chart

The intraday chart of #SOLUSDT is neutral.
A bullish rejection of $168 will push #Solana price towards $194, however to become bullish again, SOL has to break it to the upside and sustain price action above this level.
An inability to hold price above $168 could result in a bearish move to $154 support and, possibly, lower to $126-$138.
A daily candle closure above $186 will push Solana price towards the key Cryptolean resistance zone of $202-$209 and, possibly, higher.
An inability to sustain the price action above $167 will result in price declining towards $144-$151 the key daily support.
Intraday Chart
The intraday chart of #SOLUSDT is neutral.
A bullish rejection of $168 will push #Solana price towards $194, however to become bullish again, SOL has to break it to the upside and sustain price action above this level.
An inability to hold price above $168 could result in a bearish move to $154 support and, possibly, lower to $126-$138.

Check out the daily market updates on youtube.com/@TradeLeanCom
相關出版品
免責聲明
這些資訊和出版物並非旨在提供,也不構成TradingView提供或認可的任何形式的財務、投資、交易或其他類型的建議或推薦。請閱讀使用條款以了解更多資訊。
Check out the daily market updates on youtube.com/@TradeLeanCom
相關出版品
免責聲明
這些資訊和出版物並非旨在提供,也不構成TradingView提供或認可的任何形式的財務、投資、交易或其他類型的建議或推薦。請閱讀使用條款以了解更多資訊。