SOLUSDT Technical analysis update
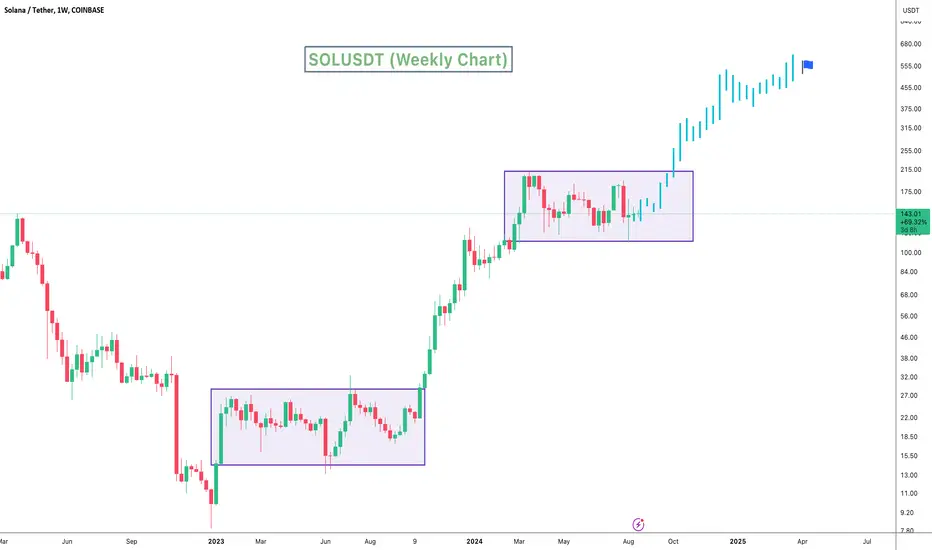
SOL has been forming a rectangle pattern for the last 170 days. The price is now approaching the rectangle's resistance, indicating a potential breakout. If the breakout occurs, we can expect a strong bullish move in SOL, with the price possibly reaching $500 in this bull run.
In day chart 200 EMA act as a good support for SOL
A similar pattern formed at the bottom, where the price stayed within a rectangle for 280 days before breaking the resistance and surging 600%. We could see a similar move once the current rectangle is broken.
Regards
Hexa
SOL has been forming a rectangle pattern for the last 170 days. The price is now approaching the rectangle's resistance, indicating a potential breakout. If the breakout occurs, we can expect a strong bullish move in SOL, with the price possibly reaching $500 in this bull run.
In day chart 200 EMA act as a good support for SOL
A similar pattern formed at the bottom, where the price stayed within a rectangle for 280 days before breaking the resistance and surging 600%. We could see a similar move once the current rectangle is broken.
Regards
Hexa
註釋

 SOLUSDT price moving toward the rectangle pattern resistance for the breakout.
🚀Telegram : t.me/hexatrades
🌐Website: hexatrades.io/
🗣️Twitter(X): twitter.com/HexaTrades
🌐Website: hexatrades.io/
🗣️Twitter(X): twitter.com/HexaTrades
相關出版品
免責聲明
這些資訊和出版物並非旨在提供,也不構成TradingView提供或認可的任何形式的財務、投資、交易或其他類型的建議或推薦。請閱讀使用條款以了解更多資訊。
🚀Telegram : t.me/hexatrades
🌐Website: hexatrades.io/
🗣️Twitter(X): twitter.com/HexaTrades
🌐Website: hexatrades.io/
🗣️Twitter(X): twitter.com/HexaTrades
相關出版品
免責聲明
這些資訊和出版物並非旨在提供,也不構成TradingView提供或認可的任何形式的財務、投資、交易或其他類型的建議或推薦。請閱讀使用條款以了解更多資訊。