
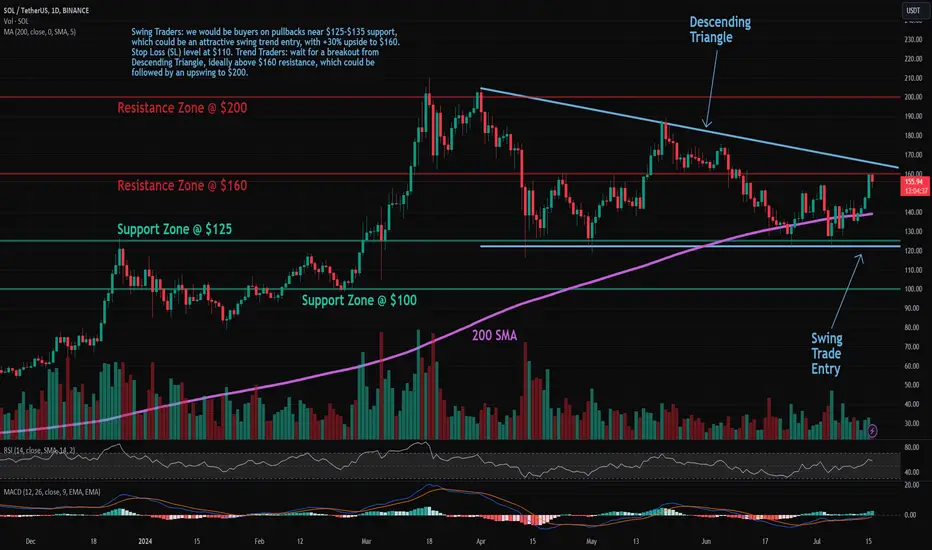
Trade setup: Price has regained 200-day moving average, which is a sign of long-term Uptrend. Swing Traders: we would be buyers on pullbacks near $125-$135 support, which could be an attractive swing trend entry, with +30% upside to $160. Stop Loss (SL) level at $110. Trend Traders: wait for a breakout from Descending Triangle, ideally above $160 resistance, which could be followed by an upswing to $200.
Pattern: Price is trading in a Descending Triangle pattern. Typically, a breakout will occur in the direction of the existing trend. Most traders will take a position once the price action breaks through the bottom line of the triangle with increased volume, which is when the price should decline an amount equivalent to the widest section of the triangle. Learn to trade chart patterns in Lesson 8.
Trend: Short-term trend is Strong Up, Medium-term trend is Neutral and Long-term trend is Neutral.
Momentum: Price is neither overbought nor oversold currently, based on RSI-14 levels (RSI > 30 and RSI < 70).
Support and Resistance: Nearest Support Zone is $125.00, then $100.00. Nearest Resistance Zone is $160.00, then $200.00.
Pattern: Price is trading in a Descending Triangle pattern. Typically, a breakout will occur in the direction of the existing trend. Most traders will take a position once the price action breaks through the bottom line of the triangle with increased volume, which is when the price should decline an amount equivalent to the widest section of the triangle. Learn to trade chart patterns in Lesson 8.
Trend: Short-term trend is Strong Up, Medium-term trend is Neutral and Long-term trend is Neutral.
Momentum: Price is neither overbought nor oversold currently, based on RSI-14 levels (RSI > 30 and RSI < 70).
Support and Resistance: Nearest Support Zone is $125.00, then $100.00. Nearest Resistance Zone is $160.00, then $200.00.

免責聲明
這些資訊和出版物並非旨在提供,也不構成TradingView提供或認可的任何形式的財務、投資、交易或其他類型的建議或推薦。請閱讀使用條款以了解更多資訊。