
📊 Macro & Fundamental Context
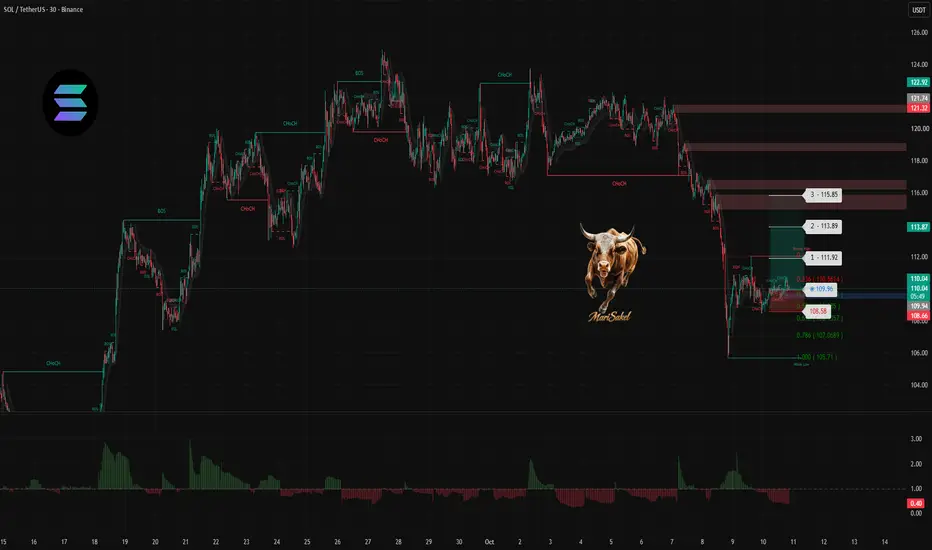
Solana is consolidating around the $110.00 threshold on the 30-minute timeframe, reflecting localized volatility contraction following recent downside expansion. Digital asset liquidity remains sensitive to broader risk appetite and weekend market positioning, keeping market conditions within a short-term range-bound regime.
📈 Structural Confluences
- Price action is testing the 0.5 to 0.618 Fibonacci retracement zone ($108.58 - $109.94) confluence.
- Formation of a local bullish market structure shift (ChoCH) and internal change of character near the current base.
- Volume profile shows contraction on the sell-side, signaling exhaustion of short-term selling pressure.
🎯 Execution & Risk Parameters
- Entry / Plan Trigger Zone: $109.00 - $110.50 upon confirmed support hold and lower timeframe bullish reversal candle.
- Invalidation / Stop Loss: $107.50 (Daily/4H close below $107.50 invalidates the setup).
- Target 1 (TP1): $113.89 (First local liquidity pool and minor resistance).
- Target 2 (TP2): $115.85 (Major intermediate supply zone).
- Risk to Reward Ratio: 1:3.1
🗺️ Two-Scenario Roadmap (Trading Plan)
- Bullish Primary Scenario: Holding the $109.00 support area sparks a recovery wave toward the $113.89 and $115.85 resistance levels.
- Bearish Alternative Scenario: Loss of the $107.50 level opens the path toward deeper liquidity pools around the $105.71 Fibonacci extension level.
💡 Conclusion & Key Takeaway
Patience is vital while waiting for confirmation at key structural support zones rather than chasing mid-range volatility. This setup offers a defined risk profile for the upcoming session.
⚠️ Disclaimer Requirement
*DISCLAIMER: This post is for educational and technical analysis purposes only. It does not constitute investment or financial advice.*
Solana is consolidating around the $110.00 threshold on the 30-minute timeframe, reflecting localized volatility contraction following recent downside expansion. Digital asset liquidity remains sensitive to broader risk appetite and weekend market positioning, keeping market conditions within a short-term range-bound regime.
📈 Structural Confluences
- Price action is testing the 0.5 to 0.618 Fibonacci retracement zone ($108.58 - $109.94) confluence.
- Formation of a local bullish market structure shift (ChoCH) and internal change of character near the current base.
- Volume profile shows contraction on the sell-side, signaling exhaustion of short-term selling pressure.
🎯 Execution & Risk Parameters
- Entry / Plan Trigger Zone: $109.00 - $110.50 upon confirmed support hold and lower timeframe bullish reversal candle.
- Invalidation / Stop Loss: $107.50 (Daily/4H close below $107.50 invalidates the setup).
- Target 1 (TP1): $113.89 (First local liquidity pool and minor resistance).
- Target 2 (TP2): $115.85 (Major intermediate supply zone).
- Risk to Reward Ratio: 1:3.1
🗺️ Two-Scenario Roadmap (Trading Plan)
- Bullish Primary Scenario: Holding the $109.00 support area sparks a recovery wave toward the $113.89 and $115.85 resistance levels.
- Bearish Alternative Scenario: Loss of the $107.50 level opens the path toward deeper liquidity pools around the $105.71 Fibonacci extension level.
💡 Conclusion & Key Takeaway
Patience is vital while waiting for confirmation at key structural support zones rather than chasing mid-range volatility. This setup offers a defined risk profile for the upcoming session.
⚠️ Disclaimer Requirement
*DISCLAIMER: This post is for educational and technical analysis purposes only. It does not constitute investment or financial advice.*
交易進行
交易結束:目標達成

免責聲明
這些資訊和出版物並非旨在提供,也不構成TradingView提供或認可的任何形式的財務、投資、交易或其他類型的建議或推薦。請閱讀使用條款以了解更多資訊。