
Solana (SOL) technical analysis:
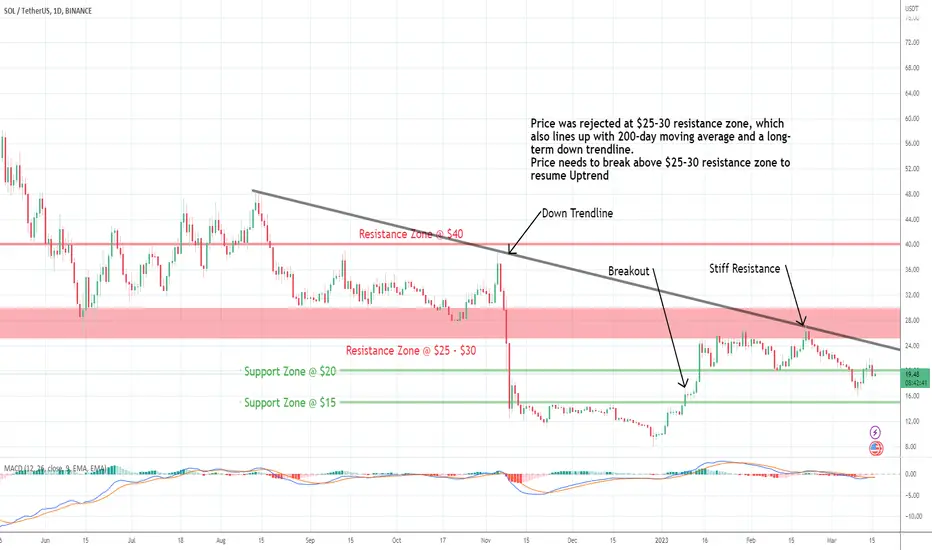
Trade setup: Price was rejected $25-30 resistance zone, which also lines up with 200-day moving average and a long-term down trendline. That makes that a very stiff resistance zone. Price needs to break above this stiff resistance area to indicate that buyers have soaked up all the supply overhang and to signal trend reversal.
Trend: Downtrend across all time horizons (Short- Medium- and Long-Term).
Momentum is Bearish but inflecting. MACD Line is below MACD Signal Line and RSI is below 45 but momentum may have bottomed since MACD Histogram bars are rising, which suggests that momentum could be nearing another upswing.
Support and Resistance Nearest Support Zone is $20, then $15. The nearest Resistance Zone is $25 – $30, then $40.
Trade setup: Price was rejected $25-30 resistance zone, which also lines up with 200-day moving average and a long-term down trendline. That makes that a very stiff resistance zone. Price needs to break above this stiff resistance area to indicate that buyers have soaked up all the supply overhang and to signal trend reversal.
Trend: Downtrend across all time horizons (Short- Medium- and Long-Term).
Momentum is Bearish but inflecting. MACD Line is below MACD Signal Line and RSI is below 45 but momentum may have bottomed since MACD Histogram bars are rising, which suggests that momentum could be nearing another upswing.
Support and Resistance Nearest Support Zone is $20, then $15. The nearest Resistance Zone is $25 – $30, then $40.

免責聲明
這些資訊和出版物並非旨在提供,也不構成TradingView提供或認可的任何形式的財務、投資、交易或其他類型的建議或推薦。請閱讀使用條款以了解更多資訊。