
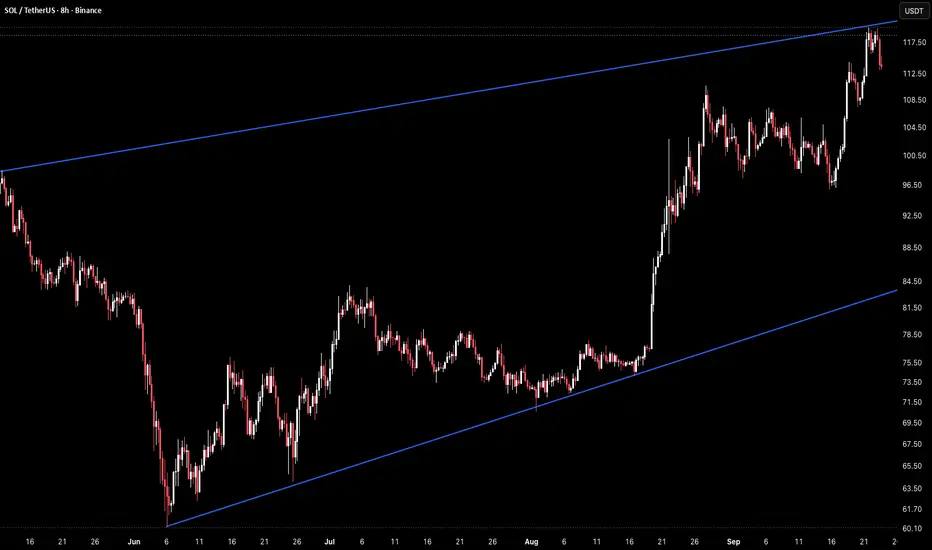
Solana is trading around 113.90 on the 8H timeframe after breaking out sharply from the range that held throughout July and August, now pushing directly into the upper boundary of the rising channel that has framed this entire structure since the June low.
The broader pattern began with a steep decline into early June, bottoming near 60.10 at the point where the lower channel trendline originates. From there, price built a wide basing range between roughly 73 and 84 through most of July and August, with the upper channel trendline running well above the entire time. That range finally resolved with a strong breakout in late August, sending price from the low 70s up through 100 and continuing into a fresh push toward the channel's upper boundary near current levels.
Price is currently testing that upper trendline directly after tagging a high near 118, pulling back slightly to 113.90 as the market decides whether to break through or roll over from this resistance.
Key Levels To Watch:
→ 118.00 Recent high, upper channel trendline resistance
→ 113.90 Current price, testing channel resistance
→ 108.50 Prior swing high, first support on a pullback
→ 100.50 Breakout level, key flip zone from the range
→ 84.00 Range high, deeper support if breakout fails
→ 60.10 Channel origin, June low
A break and hold above 118 confirms the channel resistance is broken, opening the door to a continuation move with the breakout strength suggesting further upside if this level gives way.
Rejection from the channel trendline sends price back down to retest 100.50, and a deeper pullback would bring the 84.00 range high back into focus as the next support.
Hold above 100.50 and SOL stays on track for a channel breakout. Rejection here keeps price capped inside the channel for now.
Bias stays bullish given the strength of the breakout that preceded this test, but the reaction at the channel trendline is the level that decides the next move.

免責聲明
這些資訊和出版物並非旨在提供,也不構成TradingView提供或認可的任何形式的財務、投資、交易或其他類型的建議或推薦。請閱讀使用條款以了解更多資訊。