
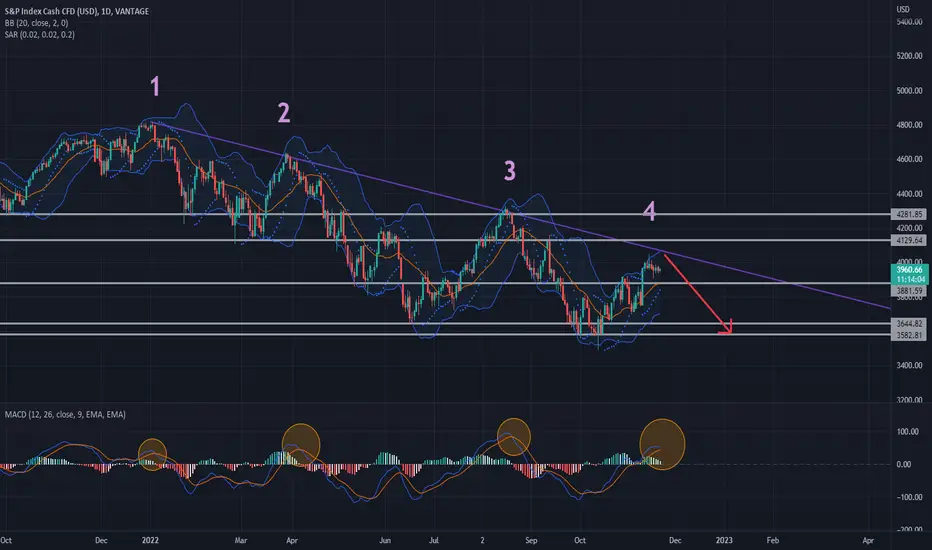
S&P500: By the book again?
Classic technical analysis! Literally a school of technical analysis!
In its last 3 attempts, the index tried to break the resistance level while MACD shows 'the cross' (the blue line dropped below the orange one which indicates a change in the trend) and led the market to another down-trend period of several weeks.
As you can clearly see on the graph, the index has failed every time since the beginning of the year, will the situation be different this time?
Trade safe!
註釋
By the book
免責聲明
這些資訊和出版物並非旨在提供,也不構成TradingView提供或認可的任何形式的財務、投資、交易或其他類型的建議或推薦。請閱讀使用條款以了解更多資訊。
免責聲明
這些資訊和出版物並非旨在提供,也不構成TradingView提供或認可的任何形式的財務、投資、交易或其他類型的建議或推薦。請閱讀使用條款以了解更多資訊。