
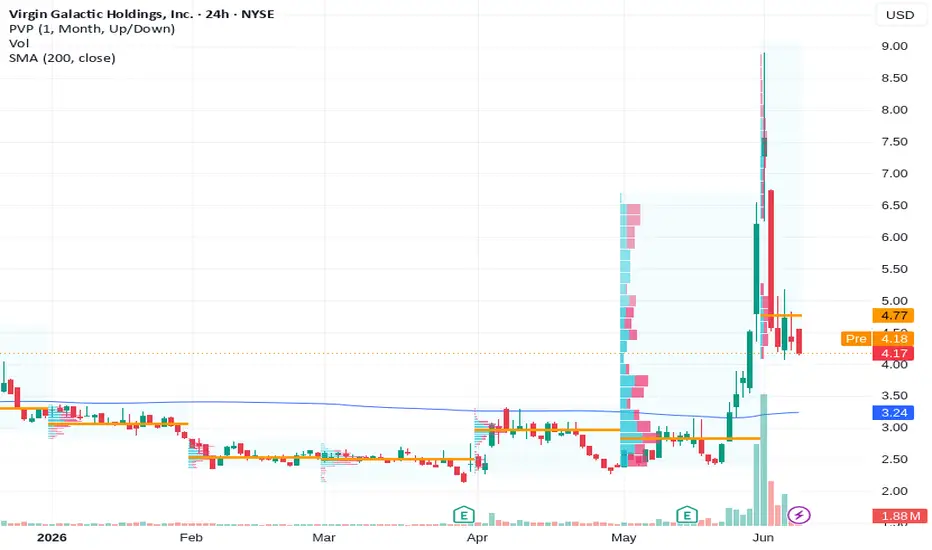
Current Price: 4.38 (Analysis was generated on Monday Morning)
Direction: LONG
Confidence level: 45%(Professional trader coverage is limited, but social sentiment tilts bullish (7 bullish vs 3 bearish tweets) and options data shows heavy call concentration at $4.50, suggesting upside pressure if resistance breaks.)
Targets
Target 1: 4.50
Target 2: 4.95
Stop Levels
Stop 1: 4.10
Stop 2: 3.75
Key Insights:
Here's what's driving this setup. Options flow around SPCE is heavily concentrated at the $4.50 strike, with extremely large call volume compared to nearby strikes. When traders pile into upside calls like this, market makers often hedge their exposure by buying shares as price approaches the strike. That dynamic can create a short‑term momentum push.
At the same time, social sentiment on X is leaning bullish. In the recent batch of trading conversations, bullish commentary outnumbers bearish posts by more than two to one. That’s not overwhelming conviction, but it does show traders leaning toward upside speculation rather than positioning for a drop.
Another factor worth watching is volatility expectations. Implied volatility across SPCE options is extremely elevated, with readings above 180% in some contracts. That usually signals traders expect a sharp move rather than slow sideways trading. When volatility compresses into a tight range like the current $4.00–$4.50 zone, the eventual breakout can happen quickly.
Recent Performance:
SPCE is trading at $4.38 after repeatedly bouncing near the $4.00 level in recent sessions. That zone has become the most visible support area on the chart. Each dip toward $4 has attracted buyers, which suggests short‑term traders are defending that level.
Meanwhile, price keeps pressing toward the mid‑$4 range. The stock hasn't cleared $4.50 yet, but the repeated tests of that area show growing pressure. When a stock pushes against resistance several times in a short period, it often signals traders preparing for a breakout attempt.
Expert Analysis:
Several professional traders following speculative aerospace names are focused on the $4.50 options wall. Many traders see this level as the trigger point. If SPCE pushes through it with volume, buying momentum could accelerate toward the next cluster of options activity near the high‑$4 range.
Traders are also paying attention to the $4.00 support zone. That level lines up with heavy put positioning and recent price bounces. If SPCE loses that area, momentum traders would likely step aside quickly. That's why stops are placed just below the lower support structure.
What I’m seeing overall is a volatility compression setup — price stuck between a well‑defined support floor and a crowded options resistance level.
News Impact:
From a fundamental standpoint, analyst coverage remains cautious with several firms maintaining bearish ratings and price targets below current levels. However, SPCE has historically traded more on speculative interest and momentum than traditional valuation metrics.
Minor insider buying reported over the past few months adds a small supportive signal. It’s not large enough to shift the fundamental story, but traders often view insider purchases as a sign management sees value at current prices.
Trading Recommendation:
Here’s my take. SPCE looks like a short‑term speculative LONG trade centered around the $4.50 breakout level. The combination of bullish social chatter and heavy call concentration suggests momentum could build if that resistance finally gives way.
I’d look for entries around the current range with strict risk control. If SPCE clears $4.50, the move could extend quickly toward the $4.90–$5.00 zone this week as options hedging flows kick in. On the downside, a drop below $4.10 would weaken the setup and signal that buyers are losing control.
This isn’t a high‑certainty trade — it’s a volatility setup based on positioning and sentiment — but the risk‑reward favors a tactical LONG attempt while price holds above the $4 support structure.
Direction: LONG
Confidence level: 45%(Professional trader coverage is limited, but social sentiment tilts bullish (7 bullish vs 3 bearish tweets) and options data shows heavy call concentration at $4.50, suggesting upside pressure if resistance breaks.)
Targets
Target 1: 4.50
Target 2: 4.95
Stop Levels
Stop 1: 4.10
Stop 2: 3.75
Key Insights:
Here's what's driving this setup. Options flow around SPCE is heavily concentrated at the $4.50 strike, with extremely large call volume compared to nearby strikes. When traders pile into upside calls like this, market makers often hedge their exposure by buying shares as price approaches the strike. That dynamic can create a short‑term momentum push.
At the same time, social sentiment on X is leaning bullish. In the recent batch of trading conversations, bullish commentary outnumbers bearish posts by more than two to one. That’s not overwhelming conviction, but it does show traders leaning toward upside speculation rather than positioning for a drop.
Another factor worth watching is volatility expectations. Implied volatility across SPCE options is extremely elevated, with readings above 180% in some contracts. That usually signals traders expect a sharp move rather than slow sideways trading. When volatility compresses into a tight range like the current $4.00–$4.50 zone, the eventual breakout can happen quickly.
Recent Performance:
SPCE is trading at $4.38 after repeatedly bouncing near the $4.00 level in recent sessions. That zone has become the most visible support area on the chart. Each dip toward $4 has attracted buyers, which suggests short‑term traders are defending that level.
Meanwhile, price keeps pressing toward the mid‑$4 range. The stock hasn't cleared $4.50 yet, but the repeated tests of that area show growing pressure. When a stock pushes against resistance several times in a short period, it often signals traders preparing for a breakout attempt.
Expert Analysis:
Several professional traders following speculative aerospace names are focused on the $4.50 options wall. Many traders see this level as the trigger point. If SPCE pushes through it with volume, buying momentum could accelerate toward the next cluster of options activity near the high‑$4 range.
Traders are also paying attention to the $4.00 support zone. That level lines up with heavy put positioning and recent price bounces. If SPCE loses that area, momentum traders would likely step aside quickly. That's why stops are placed just below the lower support structure.
What I’m seeing overall is a volatility compression setup — price stuck between a well‑defined support floor and a crowded options resistance level.
News Impact:
From a fundamental standpoint, analyst coverage remains cautious with several firms maintaining bearish ratings and price targets below current levels. However, SPCE has historically traded more on speculative interest and momentum than traditional valuation metrics.
Minor insider buying reported over the past few months adds a small supportive signal. It’s not large enough to shift the fundamental story, but traders often view insider purchases as a sign management sees value at current prices.
Trading Recommendation:
Here’s my take. SPCE looks like a short‑term speculative LONG trade centered around the $4.50 breakout level. The combination of bullish social chatter and heavy call concentration suggests momentum could build if that resistance finally gives way.
I’d look for entries around the current range with strict risk control. If SPCE clears $4.50, the move could extend quickly toward the $4.90–$5.00 zone this week as options hedging flows kick in. On the downside, a drop below $4.10 would weaken the setup and signal that buyers are losing control.
This isn’t a high‑certainty trade — it’s a volatility setup based on positioning and sentiment — but the risk‑reward favors a tactical LONG attempt while price holds above the $4 support structure.

免責聲明
這些資訊和出版物並非旨在提供,也不構成TradingView提供或認可的任何形式的財務、投資、交易或其他類型的建議或推薦。請閱讀使用條款以了解更多資訊。
免責聲明
這些資訊和出版物並非旨在提供,也不構成TradingView提供或認可的任何形式的財務、投資、交易或其他類型的建議或推薦。請閱讀使用條款以了解更多資訊。