
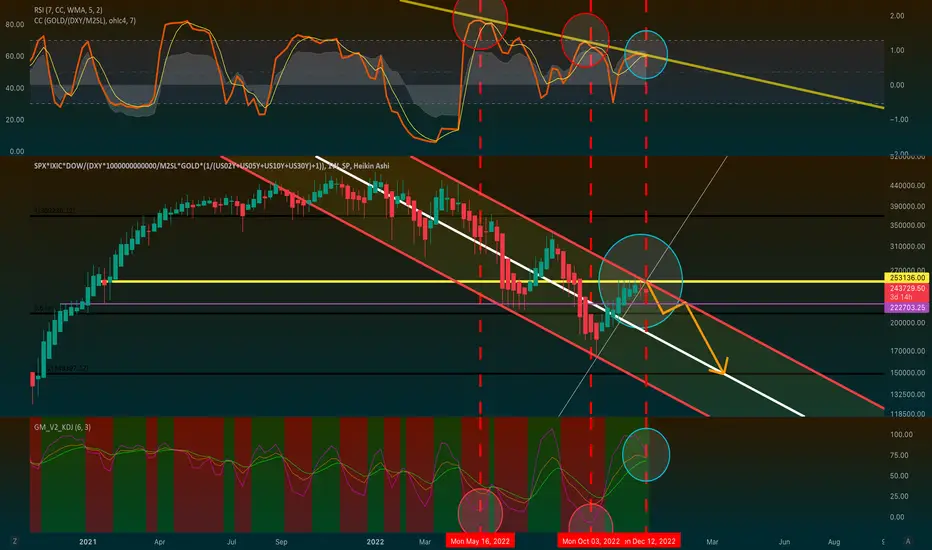
The assumption of an inverse relationship between the gold and stocks implies a negative correlation coefficient. KDJ (bottom) and CC (top) had inverse peaks and troughs in those circled periods. This time (blue circle) the two indicators aligned to fall. KDJ predicting the downfall of stocks may confirm the market equilibrium resetting. Moreover, the graph presented (explained below) displays a bounce from the significant red resistance.
Graph:
(SPX*IXIC*DOW)/(TVC:DXY*1000000000000/M2SL*TVC:GOLD*(1/(TVC:US02Y+TVC:US05Y+TVC:US10Y+TVC:US30Y)+1))
= (SPX * IXIC * DOW) / (DXY/USM2 * GOLD * U.S BONDS)
= (American Indices) / (Recession-proof Assets)
Graph:
(SPX*IXIC*DOW)/(TVC:DXY*1000000000000/M2SL*TVC:GOLD*(1/(TVC:US02Y+TVC:US05Y+TVC:US10Y+TVC:US30Y)+1))
= (SPX * IXIC * DOW) / (DXY/USM2 * GOLD * U.S BONDS)
= (American Indices) / (Recession-proof Assets)

免責聲明
這些資訊和出版物並非旨在提供,也不構成TradingView提供或認可的任何形式的財務、投資、交易或其他類型的建議或推薦。請閱讀使用條款以了解更多資訊。