
Technical Analysis and Outlook:
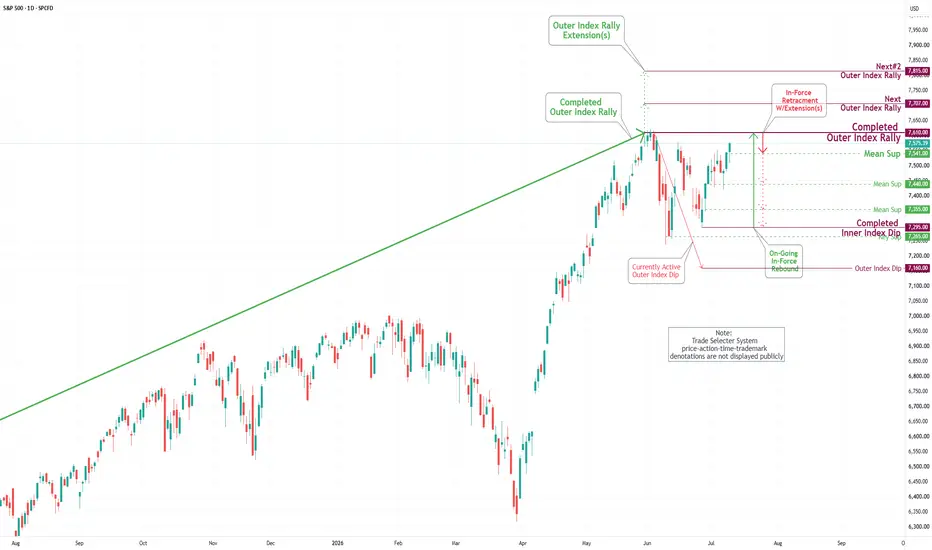
In the previous week's trading session, the S&P 500 Index posted a substantial gain after successfully retesting the Mean Support level at 7,440. This led the Index to surpass the Mean Resistance level of 7,553.
Forecasts indicate that this vital Index is likely to continue its upward trajectory, with the potential to revisit the completed Outer Index Rally at 7,610. Furthermore, there is the possibility of extending to the subsequent Outer Index Rally levels of 7,707 and 7,815.
On the other hand, there exists a significant likelihood of triggering an In-Force retracement back toward the Mean Support level at 7,440. This movement may trigger a sustained violent downward price trend, as shown in the accompanying chart.
In the previous week's trading session, the S&P 500 Index posted a substantial gain after successfully retesting the Mean Support level at 7,440. This led the Index to surpass the Mean Resistance level of 7,553.
Forecasts indicate that this vital Index is likely to continue its upward trajectory, with the potential to revisit the completed Outer Index Rally at 7,610. Furthermore, there is the possibility of extending to the subsequent Outer Index Rally levels of 7,707 and 7,815.
On the other hand, there exists a significant likelihood of triggering an In-Force retracement back toward the Mean Support level at 7,440. This movement may trigger a sustained violent downward price trend, as shown in the accompanying chart.

免責聲明
這些資訊和出版物並非旨在提供,也不構成TradingView提供或認可的任何形式的財務、投資、交易或其他類型的建議或推薦。請閱讀使用條款以了解更多資訊。