
Hi guys,
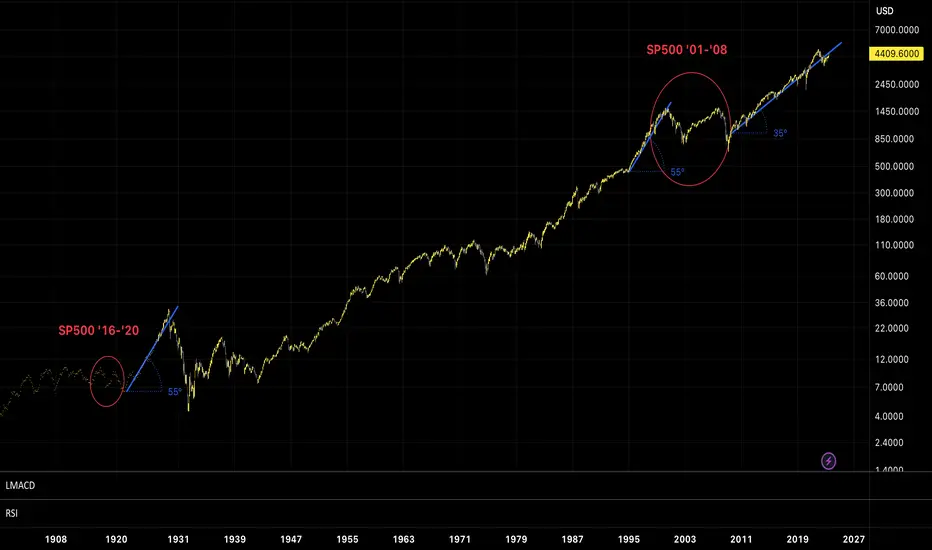
I saw a lot of fake guru comparing '16/'20 with todays'.
But in my mind is not true because if we compare '16/'20 with '01/'08 we all tend to agree the chart is so similar, but as u can see the rise after '08 crash is not in parabolic mode.
Could I'll be wrong? Of course, but if u find someone who compares chart randomly, unfollow immediately.
Let's see.
I saw a lot of fake guru comparing '16/'20 with todays'.
But in my mind is not true because if we compare '16/'20 with '01/'08 we all tend to agree the chart is so similar, but as u can see the rise after '08 crash is not in parabolic mode.
Could I'll be wrong? Of course, but if u find someone who compares chart randomly, unfollow immediately.
Let's see.

免責聲明
這些資訊和出版物並非旨在提供,也不構成TradingView提供或認可的任何形式的財務、投資、交易或其他類型的建議或推薦。請閱讀使用條款以了解更多資訊。