
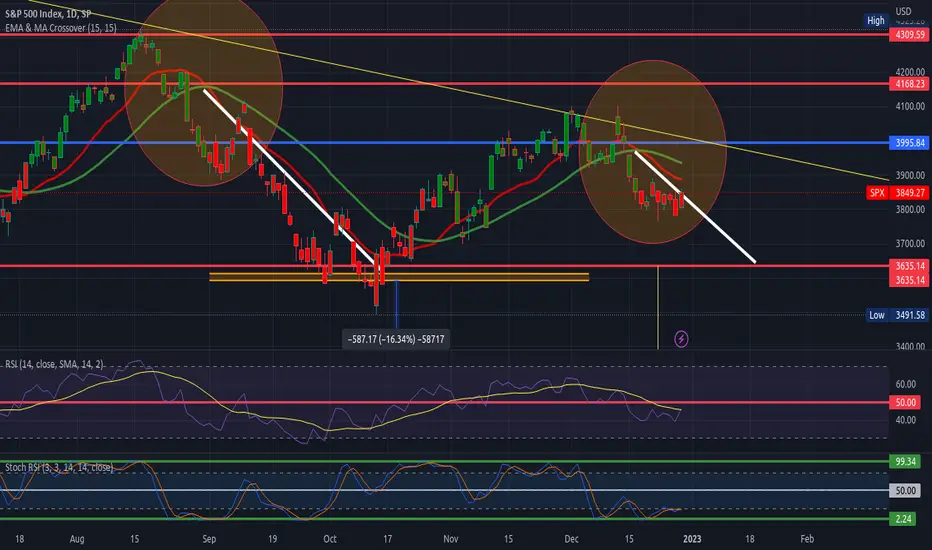
We have seen a movement similar to the two previous crosses, each of them reached the support around 3600, parallel to this pattern a downward compression triangle is forming, which can confirm a loss of support, the stochastic rsi marks oversold but the rsi is positioned downwards and the rsi is held by the bears, that is, a bearish pattern.

免責聲明
這些資訊和出版物並非旨在提供,也不構成TradingView提供或認可的任何形式的財務、投資、交易或其他類型的建議或推薦。請閱讀使用條款以了解更多資訊。
免責聲明
這些資訊和出版物並非旨在提供,也不構成TradingView提供或認可的任何形式的財務、投資、交易或其他類型的建議或推薦。請閱讀使用條款以了解更多資訊。