
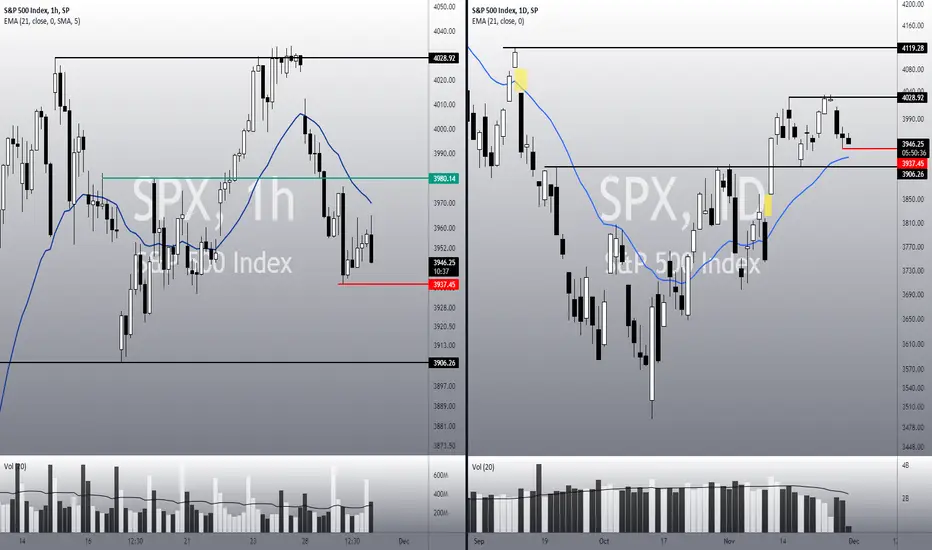
• Since it hit our first target, the index keeps falling, as there is no bullish structure to make it reverse in the short-term;
• Only if it breaks the 21 ema (1h), along with the 3,980, we might see a bullish sign;
• In the 1h chart, it is still trading below the 21 ema, doing lower highs/lows;
• In theory, it is seeking the 21 ema in the daily chart, which is quite close to other support level at 3,900 (previous bottom);
• If SPX loses 3,937, the drop might accelerate, we this is a bearish pivot point;
• Although the trend is bearish in the 1h chart, it is still bullish in the daily chart. Therefore, we must keep our eyes open, as the index is heading to a critical key point.
Remember to follow me to keep in touch with my daily analyses!
• Only if it breaks the 21 ema (1h), along with the 3,980, we might see a bullish sign;
• In the 1h chart, it is still trading below the 21 ema, doing lower highs/lows;
• In theory, it is seeking the 21 ema in the daily chart, which is quite close to other support level at 3,900 (previous bottom);
• If SPX loses 3,937, the drop might accelerate, we this is a bearish pivot point;
• Although the trend is bearish in the 1h chart, it is still bullish in the daily chart. Therefore, we must keep our eyes open, as the index is heading to a critical key point.
Remember to follow me to keep in touch with my daily analyses!

免責聲明
這些資訊和出版物並非旨在提供,也不構成TradingView提供或認可的任何形式的財務、投資、交易或其他類型的建議或推薦。請閱讀使用條款以了解更多資訊。