
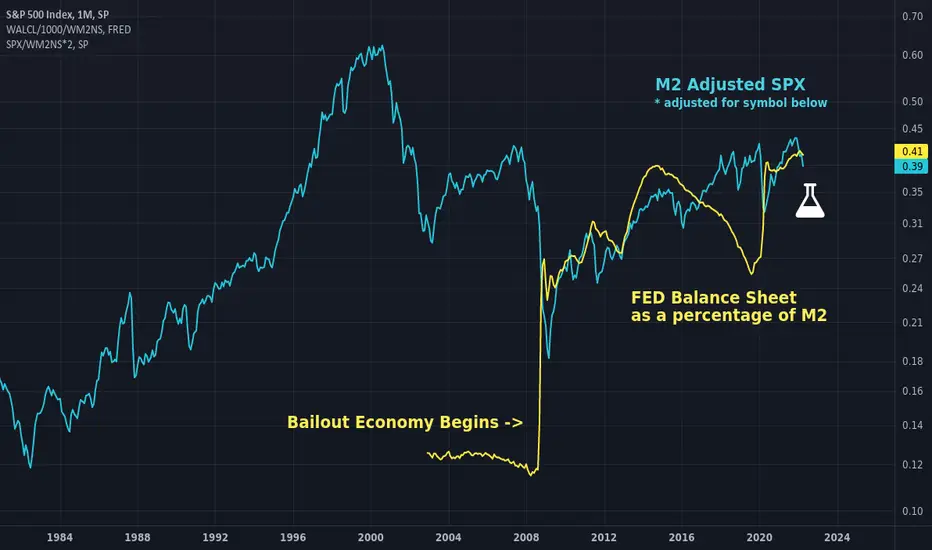
Just a combination of a couple old charts, but I wanted to make clear why assets are rising post 2008. There seems to be a direct correlation and causal relationship in FED ownership of assets as a percentage of M2 and asset prices when adjusted for M2. Lots of other charts seem to imply this by charting other things but this one shows the actual thing side by side. Perhaps the identical slope of the trend is coincidental even though the relationship is direct, it is awfully interesting though. Interpret it as you wish.
In teal: M2 adjusted SPX adjusted to overlay the symbol below.
In yellow: WALCL as a percentage of M2.
Good luck and don't forget to hedge your bets :)
In teal: M2 adjusted SPX adjusted to overlay the symbol below.
In yellow: WALCL as a percentage of M2.
Good luck and don't forget to hedge your bets :)

免責聲明
這些資訊和出版物並非旨在提供,也不構成TradingView提供或認可的任何形式的財務、投資、交易或其他類型的建議或推薦。請閱讀使用條款以了解更多資訊。
免責聲明
這些資訊和出版物並非旨在提供,也不構成TradingView提供或認可的任何形式的財務、投資、交易或其他類型的建議或推薦。請閱讀使用條款以了解更多資訊。