
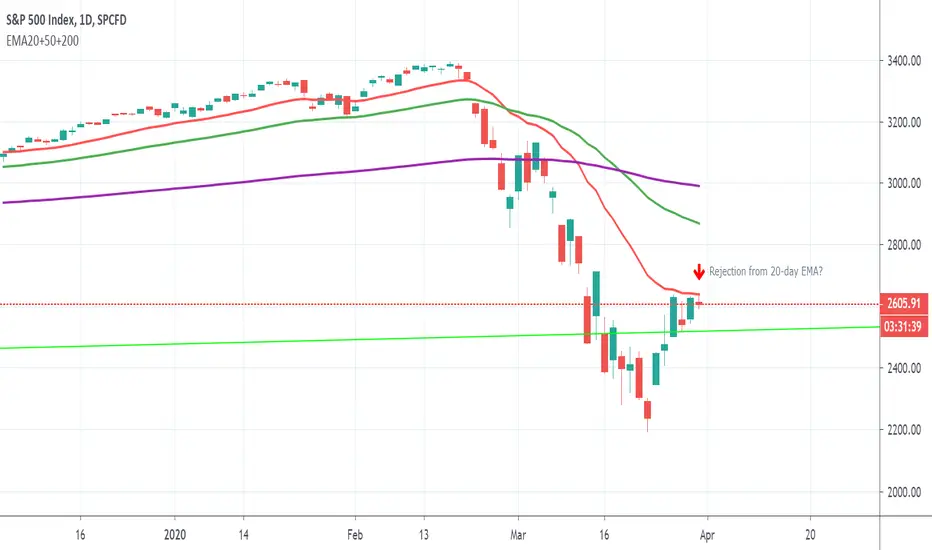
It sure looks like the S&P 500 is getting rejected from the 20-day exponential moving average (EMA) today. With support at the 10-year trend line and resistance at the 20-day EMA, the price will get squeezed between the two in the coming days, and we should see a breakout one way or another.
I tend to think the breakout will be downward. Futures markets are predicting that S&P 500 dividends will fall 30% this year, which means that the underlying value of S&P stocks continues to erode even as the price has been rallying. The price is only about 18% off its high, so it looks to me like the dividend drop may not be priced in yet.
If you're going to take a short position, you could enter near resistance at the 20-day EMA and set a stop loss just above it. Or you could wait for the 10-year trend line to break.
註釋
Here's a counterpoint to my own argument about dividends not being priced in yet.Although the S&P 500 is only down about 18% off its high, the equal-weight S&P 500 index is down about 30%.
註釋
Looks like we've cracked the trend line this morning.
免責聲明
這些資訊和出版物並非旨在提供,也不構成TradingView提供或認可的任何形式的財務、投資、交易或其他類型的建議或推薦。請閱讀使用條款以了解更多資訊。