搜尋
產品
社群
市場
經紀商
更多
TW
立即開始
S&P 500指數
做多
2022年11月13日
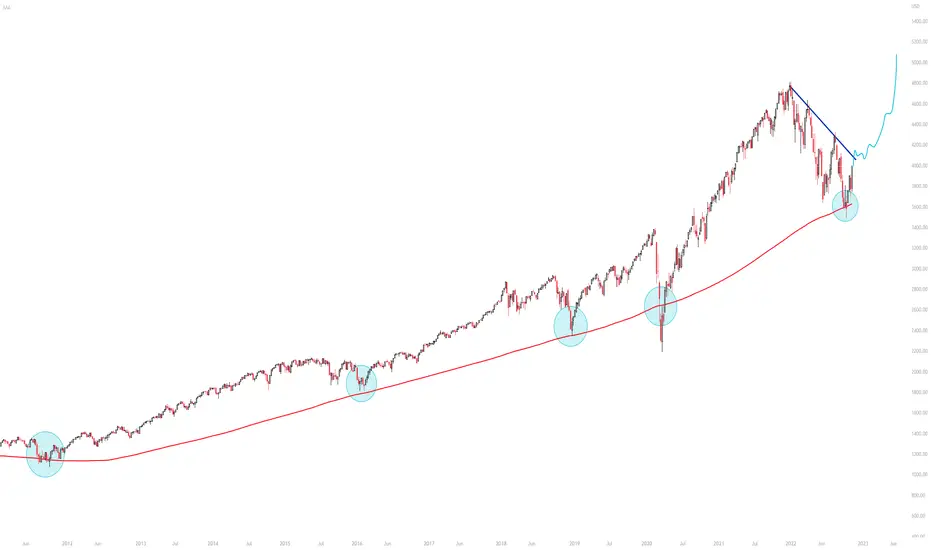
History repeats itself
1
取得這個圖表
136
SPX500 Back at 200 MA
Historical Support
Look For a breakout of descending resistance with volume
CPI Data released with a bullish outlook
Advanced_Analyst
關注
正在關注
200ma
bounce
Chart Patterns
Technical Indicators
moving_average
pulback
SPX (S&P 500 Index)
S&P 500 (SPX500)
Trend Analysis
免責聲明
這些資訊和出版物並非旨在提供,也不構成TradingView提供或認可的任何形式的財務、投資、交易或其他類型的建議或推薦。請閱讀
使用條款
以了解更多資訊。
200ma
bounce
Chart Patterns
Technical Indicators
moving_average
pulback
SPX (S&P 500 Index)
S&P 500 (SPX500)
Trend Analysis
Advanced_Analyst
關注
正在關注
免責聲明
這些資訊和出版物並非旨在提供,也不構成TradingView提供或認可的任何形式的財務、投資、交易或其他類型的建議或推薦。請閱讀
使用條款
以了解更多資訊。